Free powerful behavioral data marketers already have but not using

On average, marketers are using 12 different tools and one of the tools is likely Google Analytics. Are you satisfied with how you’re using Google Analytics?
A lot of marketers with budgets for marketing technology tools are likely going to invest in analytics tools beyond Google Analytics. CMO survey also indicates a growing budget allocated to marketing analytics. According to the survey, 11.6% of the marketing budget is spent on marketing analytics.
The data you are seeing on your Free version of Google Analytics reporting is based on aggregated data. Aggregated data is easy to use, but it is not the best for visualizing visitors’ behavior data on your web site in detail.
Furthermore, you are under constraints of the tool’s specifications such as 90 days as maximum lookback window.
In this blog post, I’d like to introduce hit based tracking with Google Analytics Free version, that many marketers don’t know about. It is a powerful tracking approach to unleash user behavioral data that is already being collected in Google Analytics.
Limitations of Free Google Analytics that you can overcome
You may be annoyed with Google Analytics because the analysis you want to do is hampered by some of the limitations known by many marketers.
- Data Sampling – Free Google Analytics estimates rather than counting all records.
- 90 days maximum lookback window for user-based reports such as lifetime value, mulch-channel, and attribution.
- “Landing page” and “Second page” are provided as dimension, but no further page such as “Third page” nor “Forth page” are available in the reporting.
- Poor goal setting capability.
- You can set up a goal with the destination URL but can’t set it up in a more sophisticated manner such as “more than X seconds of time-on-page in the destination URL”.
- Or you can set up a goal with a threshold of pages/session but can’t to set pages/session of only certain pages such as product detail pages.
- Complexed concept of “Scope” that you must understand when you set up your Custom Report
- “Average time on site” is provided as measurement, but no “Median” nor “Mode” is given and sometimes “Average” is far from the ideal representative value.
Have you been frustrated by any of them?
Frustrated marketers would explore other third-party analytics tools without a plan.
Before you start investing in very expensive tools to replace or supplement your Google Analytics, read this and let us know what you think. We’ve helped many clients get more value out of their Free version of Google Analytics, and our customers are very happy.
Let’s look into hit based data and how this could help many marketers avoid unnecessary expenses.
What does the hit based data look like in Google Analytics?
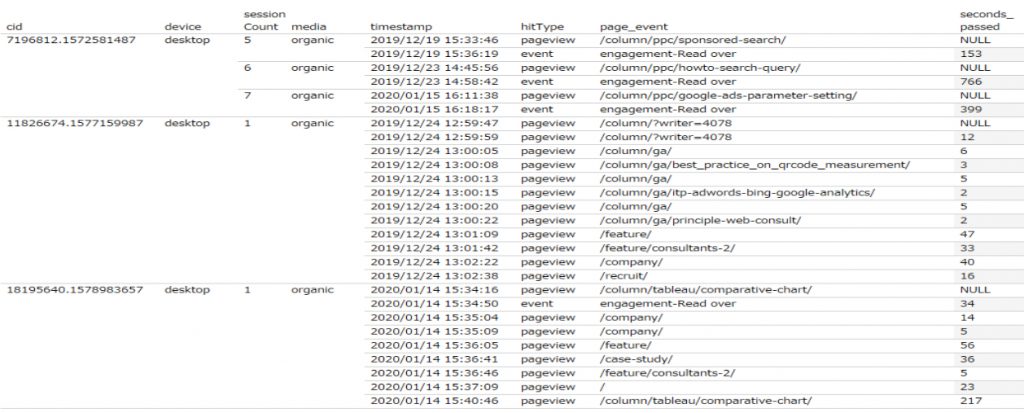
Hit based data is the most granular data about visitor behavior on your web site.
You can get it in your Free Google Analytics by modifying the Google Analytics tracking code by Google Tag Manager. This is the hit based data when pulled per CID and device.
CID is ‘Client ID’. Client ID is created and assigned by the Google Analytics cookie. CID helps Google Analytics identify a user as unique, and tie their touchpoints on the website to a user.

You see every single hit of each of your site visitors, even if it is pageviews or events. You cannot get more granular data than this.
If you’re interested in knowing how to get hit level data in your Google Analytics, feel free to contact us. This involves using Google Tag Manager and custom deployment of Google Analytics tag.
Example data you can get with Hit Based data
True “time on page” measure
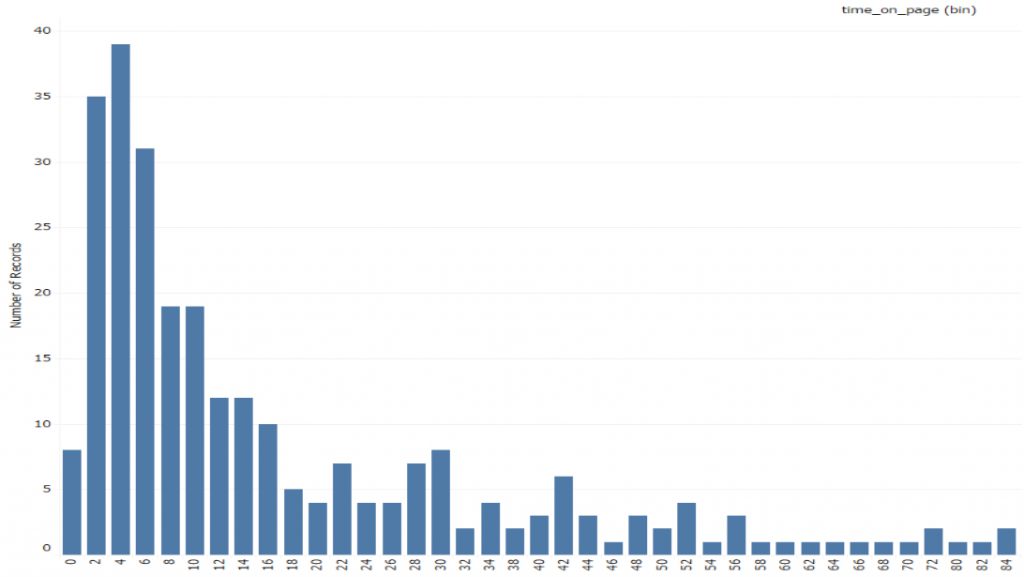
You see from the below image that the Average Time on Page for www.principle-c.com is as much as 50 seconds. You’d naturally think most users stay approximately 50 seconds and then move to another page on the site.

However, the histogram of the Time on Page based on the hit based data tells you that the most common behavior of the user is staying on that same page for only 5 seconds. In other words, the mode is 4-6 seconds bucket. You’ll never know it without the hit based data.
Note: mode is “the number that is repeated most often”

F2 Conversions
For some types of business, the 2nd purchase of the customer is a very important event as it is a sign of satisfied customers from their first purchase. Subsequent purchase means there is an increase in LTV the customer.
The second purchase of a customer is referred to as F2 Conversion, where F2 means Frequency 2.
Here is an example of when the data is visualized:

You see that your average F2 Conversion rate is around 6% in total, that 6% of your customer did second purchase.
The customers who made their first purchase via CPM (display ads cost for 1000 impressions) records the highest F2 Conversion Rate as high as 9%.
The CPA (Cost per Acquisition: The cost you pay for acquiring one conversion) of CPM tends to be not so good in general, but the good performance of the F2 Conversion rate could change your strategy on how to get the first purchase.
What does this mean for many marketers?
If you believe that you’re not maximizing your marketing data for campaign performance and looking at investing in another marketing analytics technology stack, then stop and consider these key points.
Assess your data needs
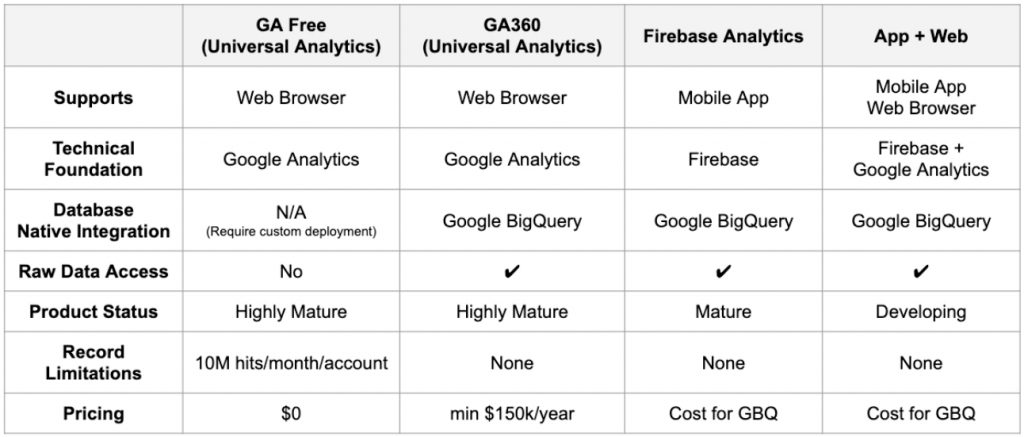
Once you have the right web analytics deployment, then why not take advantage of what a free version of Google Analytics has to offer? Here is a table diagram that shows the value differences provided by different Google Analytics products.

Fix your tracking and start collecting good data
As this blog post What we learned from auditing over 100 websites with Google Analytics indicate, the majority of the websites are collecting bad or wrong data. Let’s fix that first before you invest in another technology that you’re going to implement wrong.
Use your Google Analytics to really optimize your digital paid media campaigns
Data without analysts or marketers are just records of information stored in a database. Marketing data is actionable only if marketers do something with it.
CPA (cost per acquisition) is increasing, it is harder to maximize campaign ROI, and competition in the market is fierce. The great thing about Google’s solution is that it integrates well with its own Ads solution.
It is very likely that you already have all of these technology platforms enabled, just not leveraged properly. Check out these two use cases that you might find interesting in how we optimized our client’s digital marketing campaigns.
Success Stories
- How Principle increased client’s ROAS by 4x using Google Smart Shopping Campaign
- Analytics Support That Drove 3x Lift In Transactions with integrated Offline & Online data
If you find this article interesting and would like to hear from our data engineer, please contact us here.
Do you need to enable the right marketing data to grow your business?
Good data practice starts with good data collection. At Principle, we enable, integrate, and manage your marketing data. Click here to learn more about our agency services for:
- Data Management Consulting Service
- Data Visualization Services with Tableau and Data Studio
- Google Tag Management Service
- Marketing and Google Analytics Services
Co-Founder / Analytics Evangelist
Kaz is a Co-Founder of Principle and leads Principle’s search and analytics solution teams. Kaz has published books on Google Analytics and Tableau Data Visualization. He is an industry-recognized leader. Kaz retains certifications: Google Analytics Partner, Tableau Certified Professional.
