How to identify your ideal customer with CRM and Google Analytics

Changes in the digital marketing landscape due to COVID-19 pandemic
The new Coronavirus pandemic has caused a major shift in consumer needs and values. We expect that change to persist even after the epidemic is over.
We have encountered many digital marketers’ discussions, where the common questions are including but not limited to:
- How has Coronavirus changed the company’s customer base and their needs?
- How consumer values will change after the pandemic ends.
What we know from the recent trends during the crisis, more consumers have gone online to shop. The importance of digital marketing and digital transformation for companies across industries are expected to grow.
For example, Nike reported solid results for the third quarter of fiscal 2020, with online sales growth, despite the closure of many stores during the stay at home order due to the Coronavirus outbreak.
In China, the New NIKE Traning Club subscribers for promoting home exercise to Chinese consumers jumped, with the number of active users in the app increased by 80% compared to the previous season. As a result, the digital business grew by more than 30% year over year.
A similar trend has seen and commonly heard across industries where brands have taken their services online.
(*)Source
NIKE, INC. REPORTS FISCAL 2020 THIRD QUARTER RESULTS
FY 2020 Q3 Earnings Release Conference Call Transcript March 24,2020
Many marketers feel the major shift in the market and consumer trends and are aware of the need to change how they approach their target consumer base dynamically. Ability to adjust and take action swiftly will heavily influence how businesses can perform in the new normal.
This blog post will introduce how quantitative and qualitative data could be used to help define the new customer profile. The quantitative data will entail using Google Analytics and CRM data, while qualitative data would come from customer surveys.
The key point is to analyze your high-value customers based on their most recent transactions and behavioral data. With that data, you’ll better identify the new customer profile and needs while incorporating that information into building the personas.
By doing so, you can efficiently acquire potential customers who are likely to become your best customers through your customer acquisition campaign. It will also make it easier for you to develop an effective approach to communicate with your customers from their first purchase to becoming a high-value customer based on their current needs.
Conducting customer research
The Big Picture of Customer Research
Our customer research is carried out in the following flow.
- Quantitative analysis of customer profile (with CRM data)
- Quantitative analysis with behavioral data(CRM×Google Analytics)
- Qualilatitative research(Customer surveys)
- Persona Design
- Performance growth simulation against the target
- Short to Mid-term action plan to optimize sales
We’ll cover these steps below.
1. Quantitative analysis of customer profile with CRM
Map out KPI: Identify bottlenecks to address
First, we’ll review and organize your data from CRM and to map it against the KPI. For example, if one of the KPI is revenue, we’ll analyze it to see if the high-value customers perform repeat purchases or simply one-time purchase at a high price point.
We eventually build a list of meaningful business questions that are critical and close to the business’s KPI.
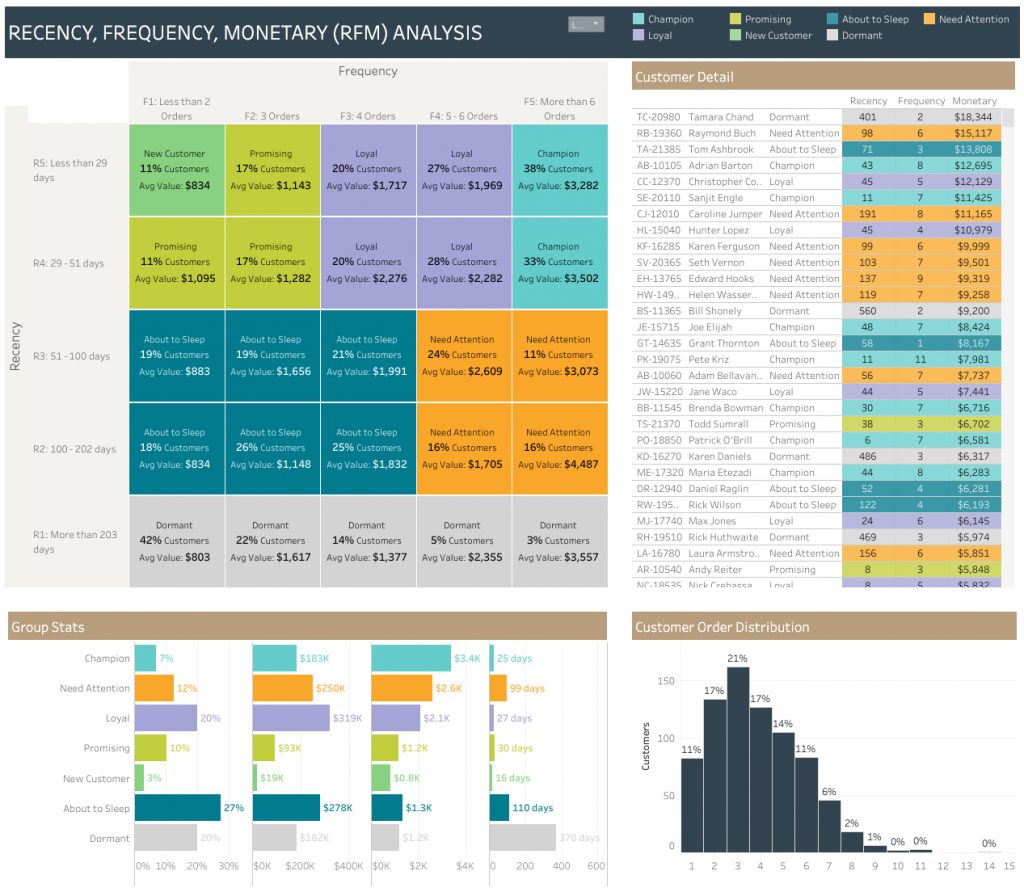
RFM Analysis and grading customer by segments
We’ll analyze the customer data in areas of Recency, Frequency, Monetary. We’ll refer to this is as RFM analysis. Through RFM analysis, we’ll classify customers by determining if they are a frequent shopper, first-time buyer, etc.
* This is our demo dashboard from Tableau Public page: Link
In-depth analysis of the customers by purchase pattern.
By narrowing down the data to good customers and analyzing user attributes, we can grasp the user profile and their needs.
The data we’d typically analyze (not limited to) are gender, age, geolocation, purchase behavior from first purchase to subsequent purchases, etc.
In the next phase, we will look at customer behavior with integrated data from CRM and web analytics. The analysis should deepen our understanding of the ideal customer.
2. Quantitative analysis with behavioral data with CRM & Google Analytics
Purpose of integrating CRM & Google Analytics
Web behavior of the customer segments created in earlier CRM analysis can help us further understand the customer profiles. CRM by itself only provides data about the customer and what they’ve purchased, but it doesn’t tell us which marketing campaign they engaged with and what products or pages they’ve viewed before deciding to buy.
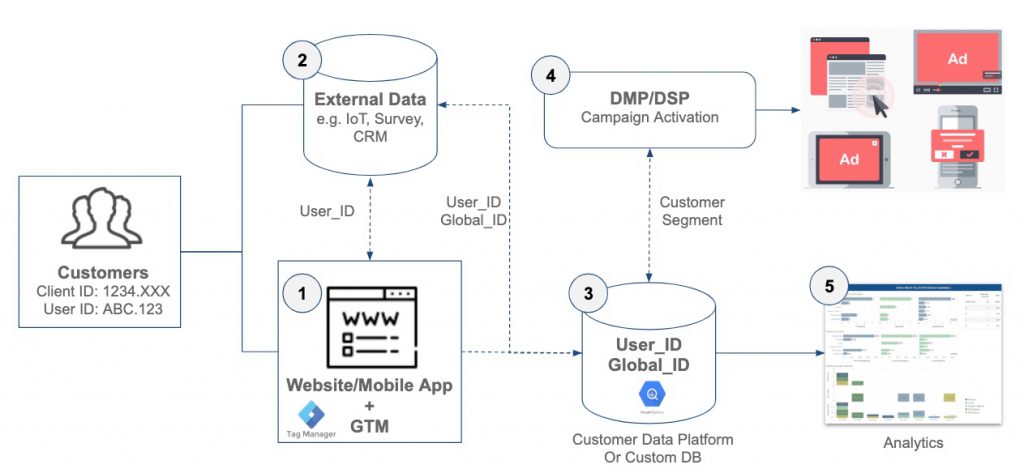
Requirements for integrating Google Analytics with CRM
Google Analytics integration with CRM requires an additional setup that is not available out of the box. Specifically, you will need to add your member ID and ClientID (in Google Analytics) to the customer dimensions within Google Analytics, where the user’s unique ID and timestamp data is stored.
It will then be possible to obtain the detailed data of the user’s activity for the individual customer. The user behavior data with the CRM data could be integrated by using member ID as a key.
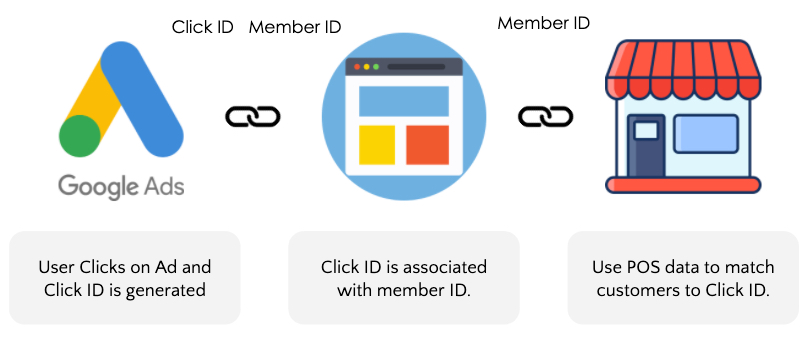
Bonus: Additional integration example below shows Member ID integration with Google Ads. Integrating IDs across platforms can bring additional values to existing capabilities.
Site usage analysis by ideal customer profile
Using CRM and Google Analytics integrated data, you can start analyzing customer behavior focusing only on the ideal customer profile. Ideal customer profile could mean anything from the amount of transaction, gender, a customer that bought multiple times, etc. That will all depend on your business goal or hypothesis that you have based on changing behavior under the Coronavirus pandemic.
Typically, we’ll import CRM data and Google Analytics data into our BI tool for analysis. We’ll use Google BigQuery to store and access data with Tableau to analyze for very large data sets.
Our process includes:
- Identify the customer journey of a customer that the business should go after. It is important to look out for changes in transaction or behavior changes Before and During COVID.
- Analyze customer touchpoints from the sources and the pages and products they’ve viewed before converting.
By digging deeper into user behavior from the above perspective, we can flesh out site usage scenarios, visitor recency, and needs.
3. Qualilatitative research – Customer surveys
Why is qualitative research necessary?
While quantitative data can confirm overall trends, qualitative research such as customer surveys effectively understands the bottleneck. For example, Google Analytics can tell us a page with a high bounce rate, but it doesn’t tell us why people immediately leave.
The same applies to many other scenarios, but it is always insightful when you know how and why your consumer behaves in a certain way.
Customer survey design points
Narrowing down the themes and objectives
In addition to asking NPS and customer satisfaction scores, it is important to design the survey to understand the customer objectives or purpose of visits.
Further acquiring inputs directly from the customers around the bottlenecks identified in the quantitative analysis will be critical. That will guide us to design the action items to tackle down the line.
Provide open text responses in addition to numerical responses
It takes more time to tally up the findings, but it is worth tracking and going through the open text responses. Hearing the real voices of your customers’ complaints and requests will give you a deeper insight into their true needs.
It is always interesting and insightful to learn the hidden desire or issues our client’s customers have in their customer experience online. The survey will certainly give us objective findings beyond the hypothesis generated from quantitative analysis.
Making sure the insights lead to improvements
Because the survey itself is one of the experiences customers go through with the brand, if there are no improvements in the customer experience after voicing their dissatisfaction or requests, it will lead to unhappy customers. That could lead to a lower response rate in future surveys.
It’s not realistic to respond to all customer feedback, but we think it’s important to take a sincere approach to customer feedback and show that you are improving.
4. Persona Design
Specific personas and prioritization
Quantitative and qualitative research results can reveal commonalities, trends, and patterns in your ideal customers. We recommend being as specific as possible in setting your ideal customer profile, like customer’s age, occupation, household structure, etc. By being specific, you can increase familiarity and interest in your persona when sharing it internally, and it makes it easier to envision the end customer you’re communicating.
Prioritize personas based on sales contribution and volume in reach. A high-value customer that is too small of a segment might not be realistic for a business to go after.
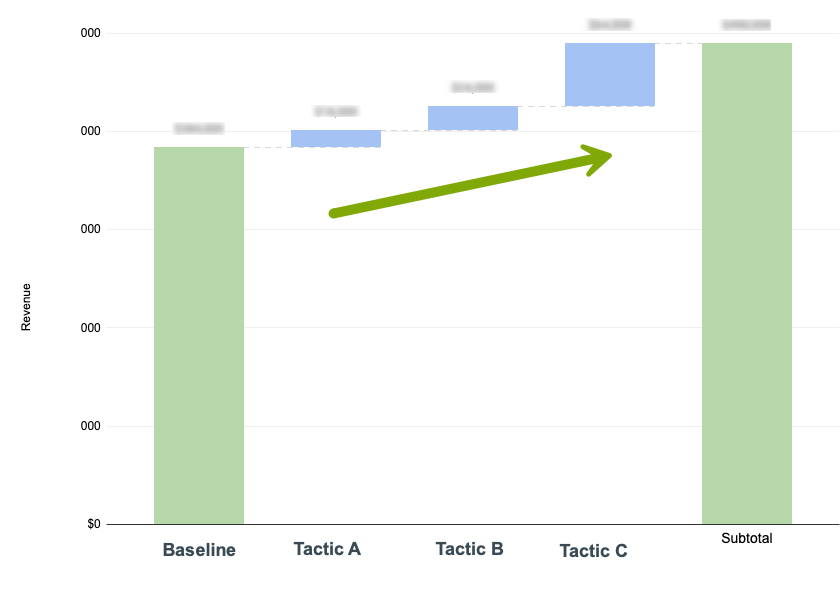
5. Performance growth simulation against the target
Sales Improvement Simulation
By identifying your ideal customer profile and personas through the above analysis, you can now focus on reaching and acquiring such customers.
Immediate action is to drive that initial purchase from the target users. Once you’re able to reach and increase your customer base, you can focus on a marketing strategy to grow customer lifetime value (or CLTV).
The insights and evidence gathered through this process are important to persuade internal stakeholders and management to further invests in your digital marketing programs.
Short to Mid-term action plan to optimize sales
What good are the insights if nothing is done. At Principle, we follow through with our clients to make sure measures are implemented to address the bottlenecks identified in the earlier process. We follow the PDCA process (Plan > Do > Check > Analyze) so that there are short and mid-term plans that should improve the business outcomes.
In the short term, we evaluate the success or failure of the implemented measures and utilize them for the next action. In the mid-term plan, we make observations of the KPI and customer feedback to confirm the med-term results, and then we make a plan for further actions.
We will adjust the course of the strategy frequently because the needs of the ideal customer (target audience) or even the client’s priorities change over time.
Final Notes
We’ve provided a brief overview of the CRM and Google Analytics integration process and our research process. We believe it is important to recognize the rapid changes occurring in the world under the pandemic and the new normal to come. Understanding your customer is even more critical, and that is possible through the technology stack that many marketers already have access to.
We would be happy if this would be of some help to you. Please don’t hesitate to reach out with any questions.
Do you need to enable the right marketing data to grow your business?
Good data practice starts with good data collection. At Principle, we enable, integrate, and manage your marketing data. Click here to learn more about our agency services for: