Firebase Analytics segment is different from Google Analytics and what marketers should know
The free version of Google Analytics for Mobile Apps (Google Analytics Services SDK for Android and iOS) has sunsetted earlier this year. Reporting access through the UI and API access has ended on January 31, 2020.
Currently, the administration screen is sparse, and you won’t be able to access the data. I’m sure many companies that used this service have already migrated to another app analytics tool.
One of the tools that you could migrate to is Firebase Analytics, which was recommended by Google, which provided Google Analytics for mobile apps.
Firebase Analytics is part of an MBaaS (mobile backend as a service) type development platform for mobile and web applications called Firebase.
The difference between Firebaseit and GA for mobile is that analytics data can be used in conjunction with other features of the Firebase platform, such as the following.
- In-App Messaging
- Cloud Messaging
- A/B Testing
You can use Analytics on its own, but if you’re building an app foundation in Firebase, you can make it easier to use data by integrating each feature.
While you can use specific features within Firebase, the platform itself works very differently from the Google Analytics for mobile apps. So it is important to be aware of the differences.
When migrating, the way the data is tracked and stored is very different, so it is necessary to investigate and use the metrics carefully.
Let’s take a look at how the reports look like in Firebase Analytics.
If you are a user of Google Analytics, you may not immediately experience a major difference. The report structure itself has a lot of similarities. However, there are some differences, especially in how segments are created.
In Firebase Analytics, segment creation takes place under “Audiences.”
In this article, I will introduce actual reports and explain how to create the “Audience” using Firebase Analytics features.
Firebase report structure
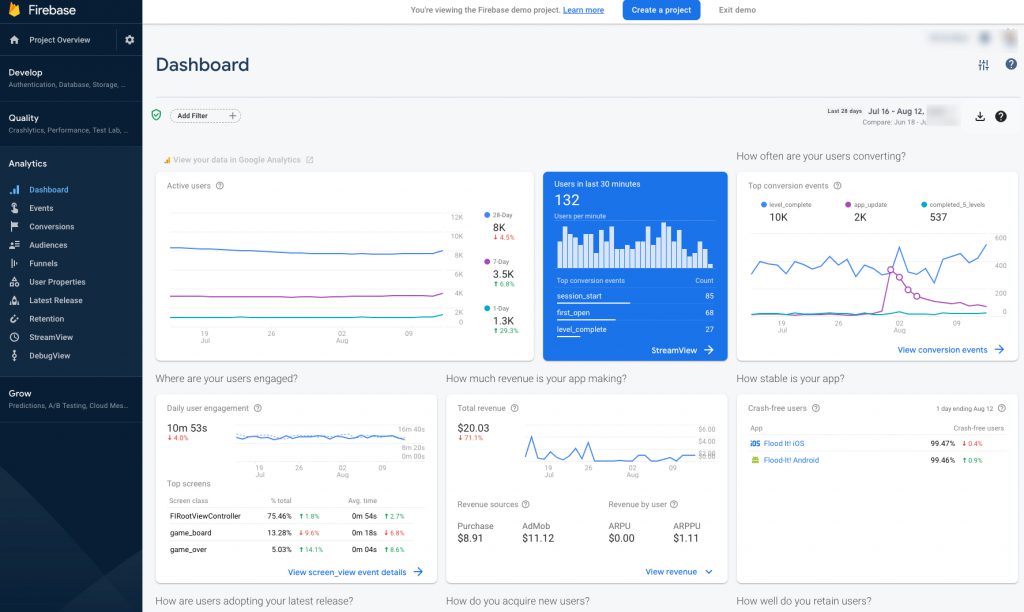
You can view this report by going to your Firebase project and go to target Projects > Analytics [Dashboard].
The Firebase Analytics report is structured similarly to the reports created in Google Analytics’s My Reports feature and allows you to see the following data.
- Number of Active Users
- Real-time Users
- Frequency of events specified for conversions
- User engagement (calculated based on Screen Class values of screen_view events)
- Amount of revenue from the app
- App stability (percentage of users who do not encounter crashes while using the app)
- Installation status after the latest app OS version was released.
- New User Acquisition (Conversions by Reference Source)
- User Retention (retention cohorts)
- Detailed user data (region, device, user demographics, interest category)
- Platform breakdown (% of iOS and Android users)
In addition to the Dashboard, there are also the following reports in a similar format.
- Events (reports by event)
- Conversions (report by each conversion)
- Retention (user retention report)
- StreamView (real-time reporting by region)
- DebugView (Event Log for Development)
You can use the reports to obtain a summary of each data.
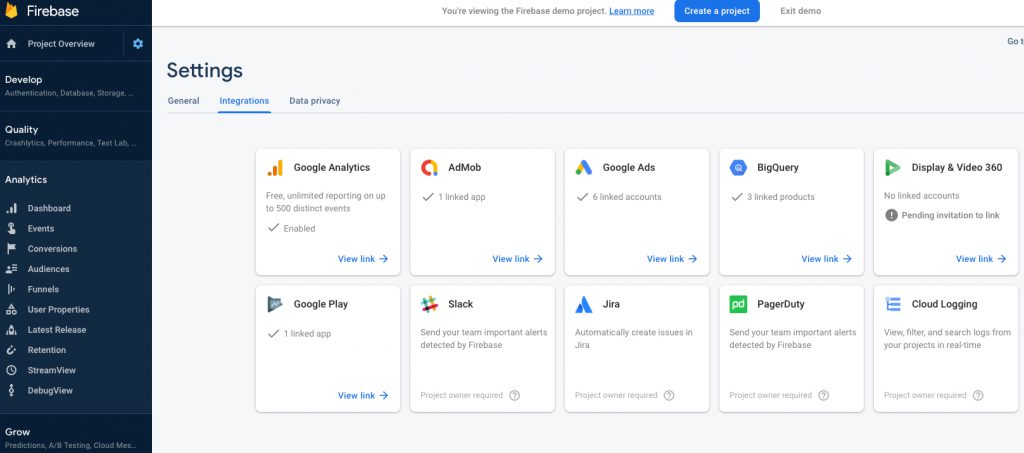
One disadvantage of the reports is that Firebase does not allow you to create custom reports. However, you can extend the report’s scope a bit by linking it to Google Analytics from the Firebase project’s admin page.
- User
- User attribute
- Behavior
- Technology
- Cross-platform
- Web
- Application
- Conversion
- All Events
You can expand the range of your canned reports by linking them. If you want to create more flexible reports and do more ad hoc analysis, in that case, you can connect Firebase Analytics with Google BigQuery. Then use the data form Google BigQuery to analyze in BI tool like Tableau or Data Studio, etc.
About Firebase’s Audience Features
You can apply the filtering and segmentation in Firebase Analytics reports.
If you click “Add Filter” at the top of the report, you can apply the standard filter features, custom audience and user properties (segment data by user age, gender, etc.) to the reports.
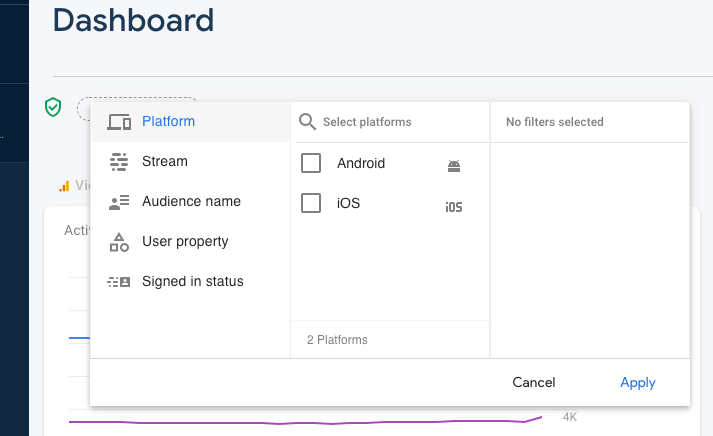
The Audiences available here are set from the Audiences menu.
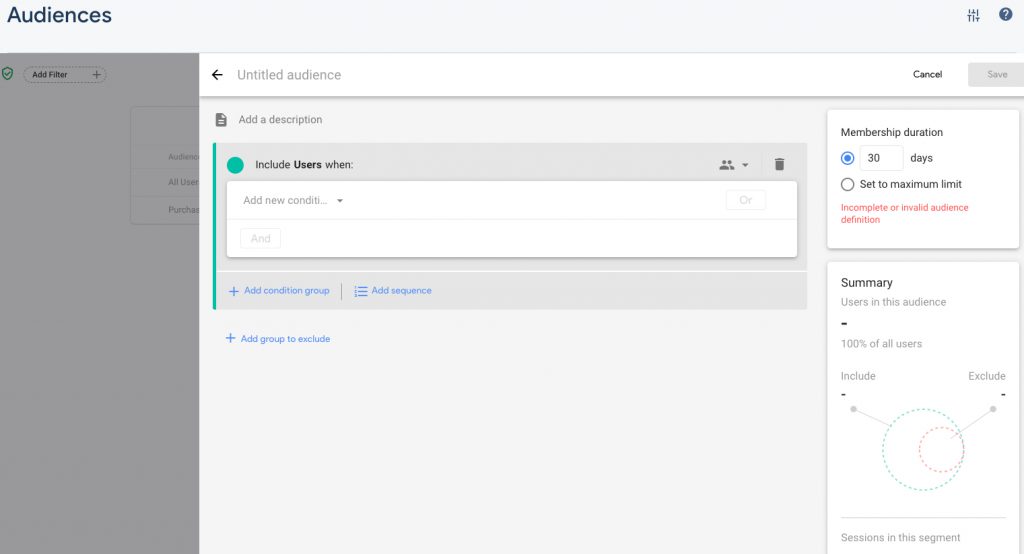
“Audiences” allows you to set up your audience like a custom Google Analytics segment.
It comes standard with two types of audiences
- All Users
- Purchasers
When created, it is similar to Google Analytics’ goal setting, where custom settings can be created from scratch or a template for non-buyers and user attributes.
Some examples of how you can specify conditions when creating a custom audience are:
- OS version
- Age
- Gender
- Number of events
These data can be used to segment users with specified events, attribute information, etc. You can also segment users who have performed a specified sequence of actions using up to 10-step sequencing capabilities.
The basic operation is similar to Google Analytics’ custom segments, but there are some tricky points when applying a condition to your own implemented custom events.
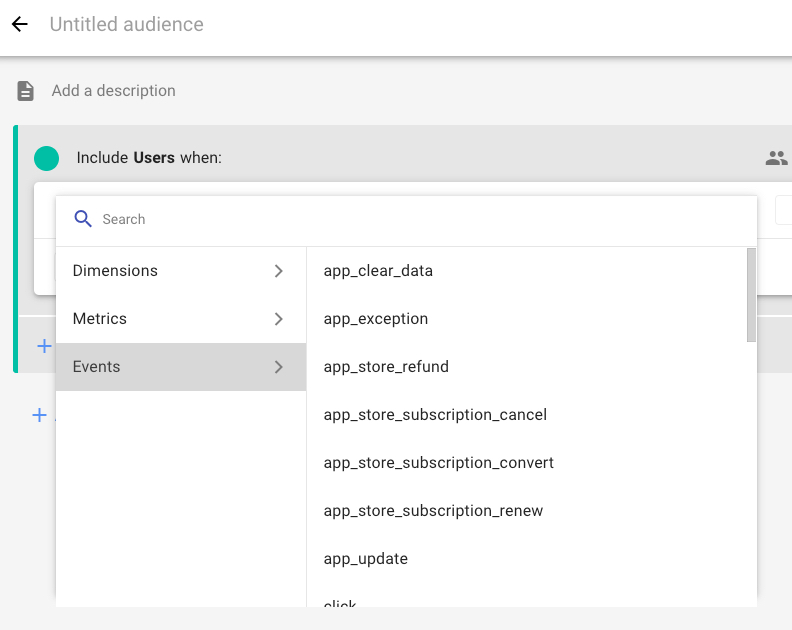
When you select the Events tab, only standard events are displayed, and custom events cannot be selected. If you want to specify a custom event, you can type it directly into the search field, and it will be suggested.
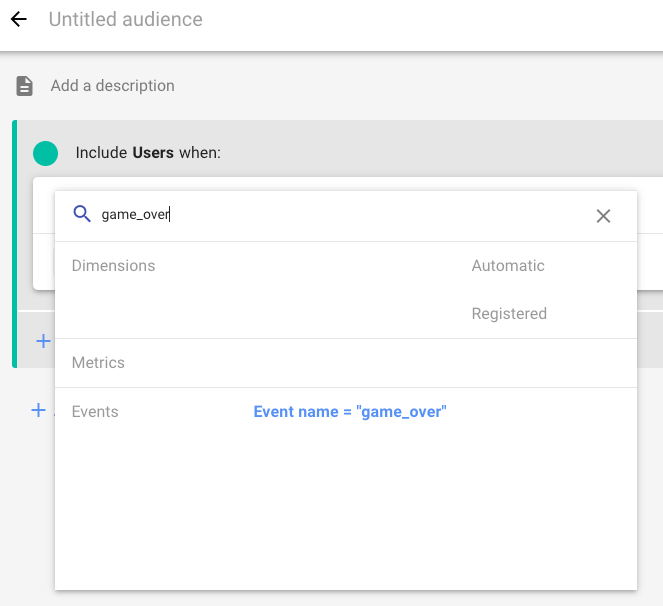
After selecting a suggestion, the same is true for the parameters associated with the event. It is probably safe to use copy and paste from “Events” to choose the event or parameters of interest.
The benefits and caveats of creating an audience with Firebase
Benefits
The benefits of using the “Audience” feature is that you can apply it in the reports, as well as in the following are:
- Google Ads campaigns
- Notifications – define which segment should receive the notification
- Remote Config target settings
For example, if you only want to see data about a particular event, the “Events” report is fine, but if you want to use the event data to target your ads, you will need to create an audience.
Caveats
However, if you plan to use this audience feature actively, please be aware of the following:
- A maximum of 100 audiences can be created per project.
- When you use age, gender, or interest data in the audience, certain targeting features may not be available.
- After building an audience, it may take 24-48 hours for users to be added.
Summary
When you are proactively using Firebase Analytics data, the audience feature is a hub for other functions and products. The insights and action taken from this hub (Firebase Analytics) could be powerful. We hope you will use it to achieve your goal.
If you find this information informative, please feel free to share this blog post. We can also help analyze your Firebase Analytics data and perform A/B testing. Please feel free to contact us if you are interested in this service.
Do you need to enable the right marketing data to grow your business?
Good data practice starts with good data collection. At Principle, we enable, integrate, and manage your marketing data. Click here to learn more about our agency services for:
- Data Management Consulting Service
- Data Visualization Services with Tableau and Data Studio
- Google Tag Management Service
- Marketing and Google Analytics Services

Senior Data Engineer
Google Marketing Platform expert with experience working with enterprises deploying marketing analytics capabilities. Guy is focused on delivering marketing technology and supports companies drive their marketing execution through data.