Multi-Touch Attribution analysis with Google Analytics Data
Google Analytics and Multi-touch attribution
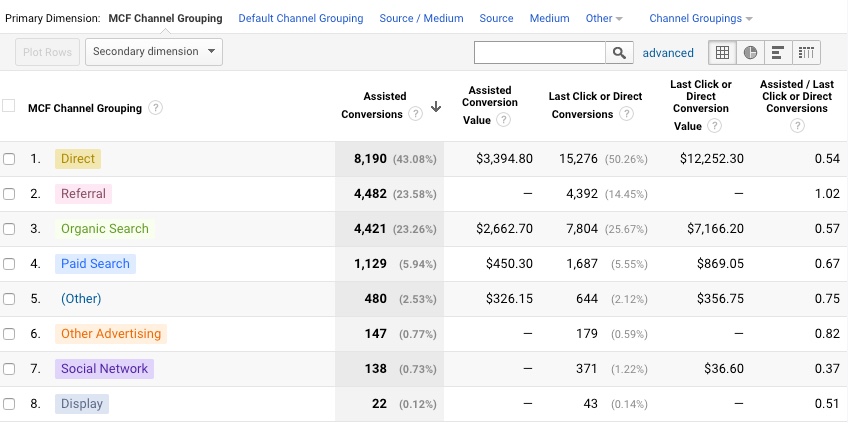
Multi-Channel Funnels (or MCF) attribution model in Google Analytics is one of the most known attribution model reporting features that are widely used by marketers. Google Analytics is known to have over 57% market share in the web analytics category, which is roughly over 4.5 million companies.
The MCF (Multi-Channel Funnels) attribution models include –
- First Interaction: Attributes 100% of the conversion to the first channel which the customer clicked.
- Last Interaction: Attributes 100% of the conversion to the last channel the customer clicked before converting.
- Last Non-Direct Click: This model ignores direct traffic to the website and attributes 100% of the conversion to the last channel that the customer clicked before converting.
- Last Google Ads Click: Attributes 100% of the conversion to the most recent Google Ads that the customer clicked before converting.
- Linear: This model gives equal credit across each channel clicked before converting.
- Time Decay: This model heavily credits the touchpoints that occurred nearest to the time of conversion. This is a useful model if you wish to give more credit to interaction occurring from the most recent promotion.
- Position Based: A hybrid model of First and Last Interaction. It gives 40% conversion credit each to the first and last interaction, and assign 20% to the rest of the interactions in the middle.
Despite such reports are available in Google Analytics, there are marketers who are not able to make these reports useful for their campaign optimization efforts. I don’t blame them, every business has different measures.
Current Landscape of Analytics BI vs. Data Science
BI and Data Science play a very important role to help marketers gain data visibility into the marketing metrics
It is no surprise that BI (Business Intelligence) is widely adopted in marketing. BI and the analytics insights you get are evaluated by marketers to understand what happened in the past. Common measures marketers would look at are the traffic volume per each step of the marketing funnel, conversion rates, average order size, etc. Marketers would assess historical campaigns that ran, and apply those learning back into the media or campaign planning.
BI has been backward-looking as the focus is about answering the business questions around “What happened?”. Through standard reporting, marketing would try to answer what happened in the past by reviewing the data marketers collected through Tag Manager, web analytics data stored in Google Analytics, or integrated data stored in a data warehouse.
Nowadays, businesses are adopting Data Science to predict what will happen based on historical data trends. Businesses want to know what they should be doing. More businesses want to be forward-looking and their usage of data so that they can answer the questions “What will happen if we do XYZ?”, or “What should we do given the budget situation?”.
Businesses that invest in Data Science find a tremendous amount of business value as they are using the data to be more proactive, or prescriptive so they can take proper action. For example, knowing the conversion rate is decreasing is interesting and not good news, but businesses would find it a lot more valuable if they knew the variables that would influence the conversion rate’s growth.
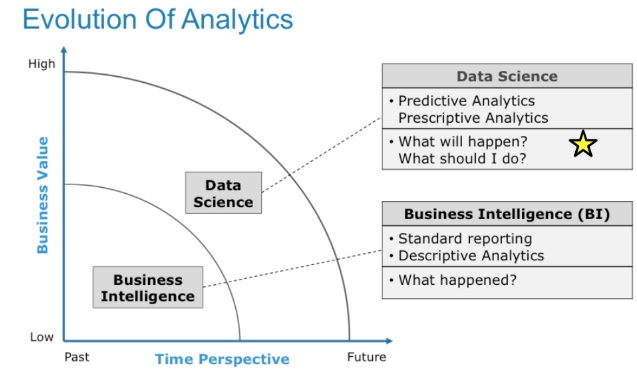
Source: Bill Schmarzo “Big Data MBA”
What is Multi-Touch Attribution (MTA)
Multi-touch attribution is a marketing analytics method that evaluates the impact of customer touchpoints in driving conversion. It helps marketers determine the value of those specific touchpoints in the buyer’s journey.
It is very common that consumers’ shopping journey span across channels and devices before resulting in a sales conversion. For marketers to optimize campaigns and create more effective customer experiences, marketers need to know those buyer touchpoints a customer came in contact with.
The objective is to understand where to put more or fewer efforts and allocate campaign budgets from those that were ineffective to an effective campaign channel.
MTA is designed to assign credit to the customer’s touchpoints that influenced the consumer to convert. The MTA models are built to measure each channel’s effectiveness for the buyer’s journey and provide a clear ROI impact from each marketing campaign execution.
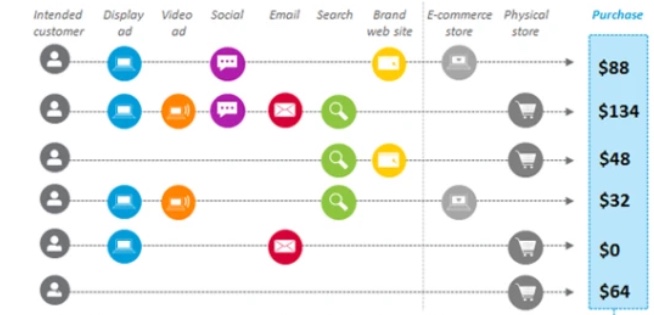
Source: Nielsen “Real Returns: What matters most in digital advertising”
What is Marketing Mix Modeling (MMM)
Marketing (or Media) mix modeling is a marketing analytics technique that helps in quantifying the impact of several marketing inputs on sales or market share. The purpose of using MMM is to understand how much each marketing input contributes to sales, and how much to spend on each marketing input.
MMM has been used by marketers for a very long time. Very common for measuring the contribution of various media investments including TV, Radio, etc. MMM allows you to measure the contribution of ad investment by comparing the sales when the ads were running Vs. the sales when the ads weren’t active.
MMM technique also takes into account seasonality, weather, promo, product launches, economic trends as long as necessary variables are provided to the model’s inputs. With MM, you’d know the optimal channel mix to drive the greatest ROI.
MMM gives you a top-down, macro-level view of your campaign efforts across the marketing channels, while MTA provides a bottom-up, user-level view of your campaign approach.
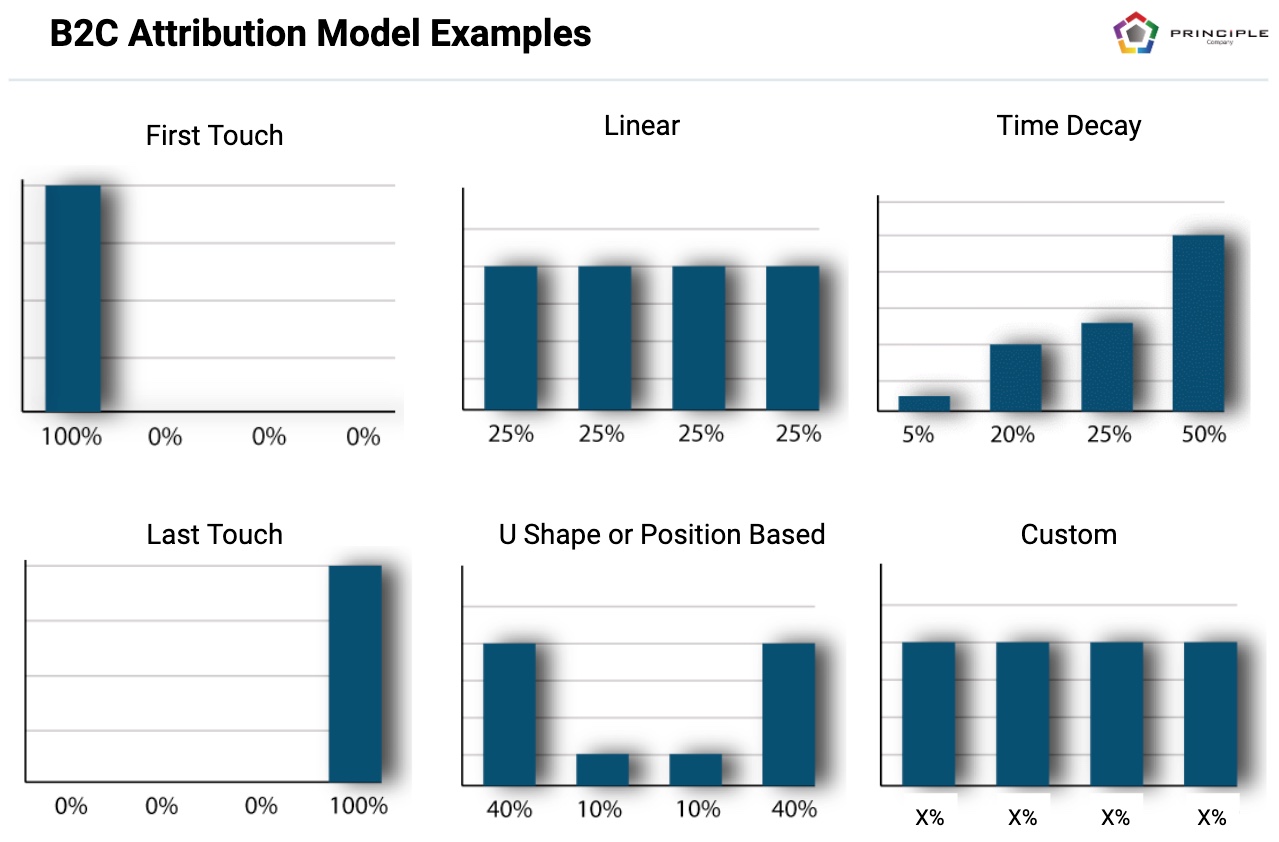
B2C Attribution Model Examples
For B2C, a common attribution model is provided in Google Analytics as MCF attribution model and reporting. The common models we see marketers use are:
First touch
Last touch
Linear
Position based
Current Landscape of Multi-Touch Attribution
Many marketers are facing challenges in measuring attribution. We hear these challenges from our contacts across various industries.
The challenges vary by businesses and the marketer’s needs, but the common area of attribution challenges are:
- Tracking, data management and reporting of MTA. A marketer is not happy with the current solution/tool that they have to meet these MTA needs.
- Lack of marketing analytics expertise and resource constraints.
- Offline and Online, cross-channel marketing influence, so a marketer is not sure where to spend more or less to optimize cost per acquisition and campaign ROI.
Our view of the current landscape of MTA are the following:
- Advanced attribution tools are making it easier for businesses to bring together the data, and analyze performance. However, marketers also need the right leadership and partner.
- According to Google’s survey, only 17% of advertisers surveyed said they are looking at the performance of all their digital channels together.
- A marketer needs an attribution model beyond the last touch. Too many marketers are optimizing and judging marketing performance based on one model and usually, that is last-touch attribution.
- To address the shortcomings of last-click, many marketers are building custom MTA models either through 3rd party tools or internal analytics resources.
- MTA is key to gain visibility into marketing impact within a short time frame. The need for marketing agility favors the models that are immediately actionable.
Challenges with Multi-Touch Attribution tools
We believe many businesses and marketers on a free Google Analytics aren’t leveraging existing capabilities to its full potentials, and marketers feel it is not enough to support their MTA reporting needs.
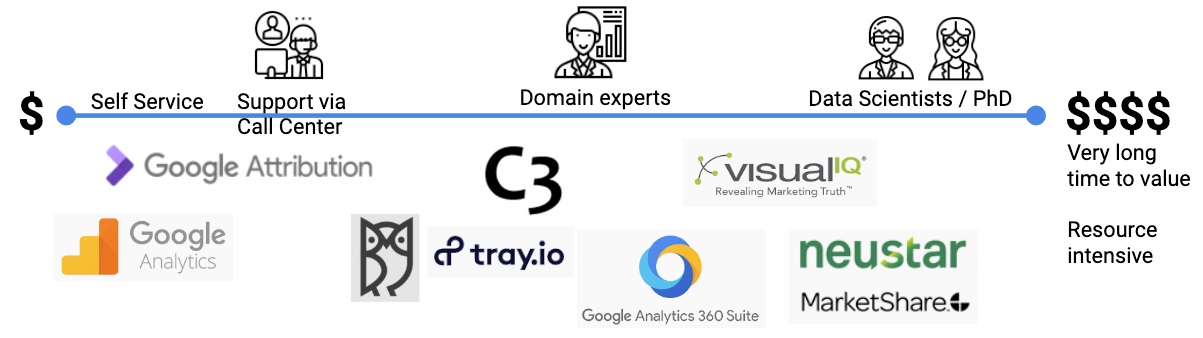
And most of the MTA solutions and services are a huge jump in terms of costs and capabilities for many businesses. The cost of enterprise-grade attribution tools is not reasonable for many businesses investing in digital marketing campaigns.
Most of the tools that support MTA rely heavily on marketer’s experience and leadership. And the majority of the enterprise-grade MTA solutions require a large monetary commitment from setup to analyzing performance.
The solution in the market lacks the bridge between data and recommendations.
How we are thinking about attribution reporting and approach
Because the majority of marketers already have access to Google Analytics and it is set up to track various marketing campaigns, we believe it is a great solution to work with. Even before considering to invest a very expensive solution, since time-to-value is a very important aspect of investing in solution/service to help marketers improve attribution visibility.
At Principle, we have a great amount of experience working with businesses in cleaning up and normalizing their Google Analytics and ad tech tracking. We’re confident that the data foundation for MTA reporting could be achieved for many marketers and businesses. Especially for those who don’t want to commit to a very expensive solution/services.
Setting up a good data foundation is a good start. But having a great data engineering resource is also important. Our experience ranges from building a custom data warehouse, queries, attribution model, and reports. We work with your data warehouse, and able to plan your MTA data needs.
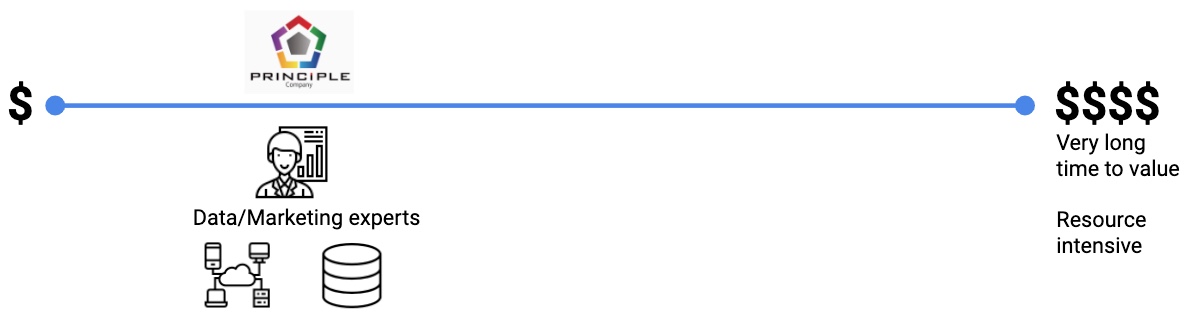
We believe a client (businesses or marketers) should retain marketing agility, test and learn before committing to a very expensive solution and services.
Here is a spectrum of where we think we’d fit in MTA solution/services, working with the ‘free’ Google Analytics and data integrations that most marketers aren’t taking advantage of.
An old approach to tracking marketing ROI
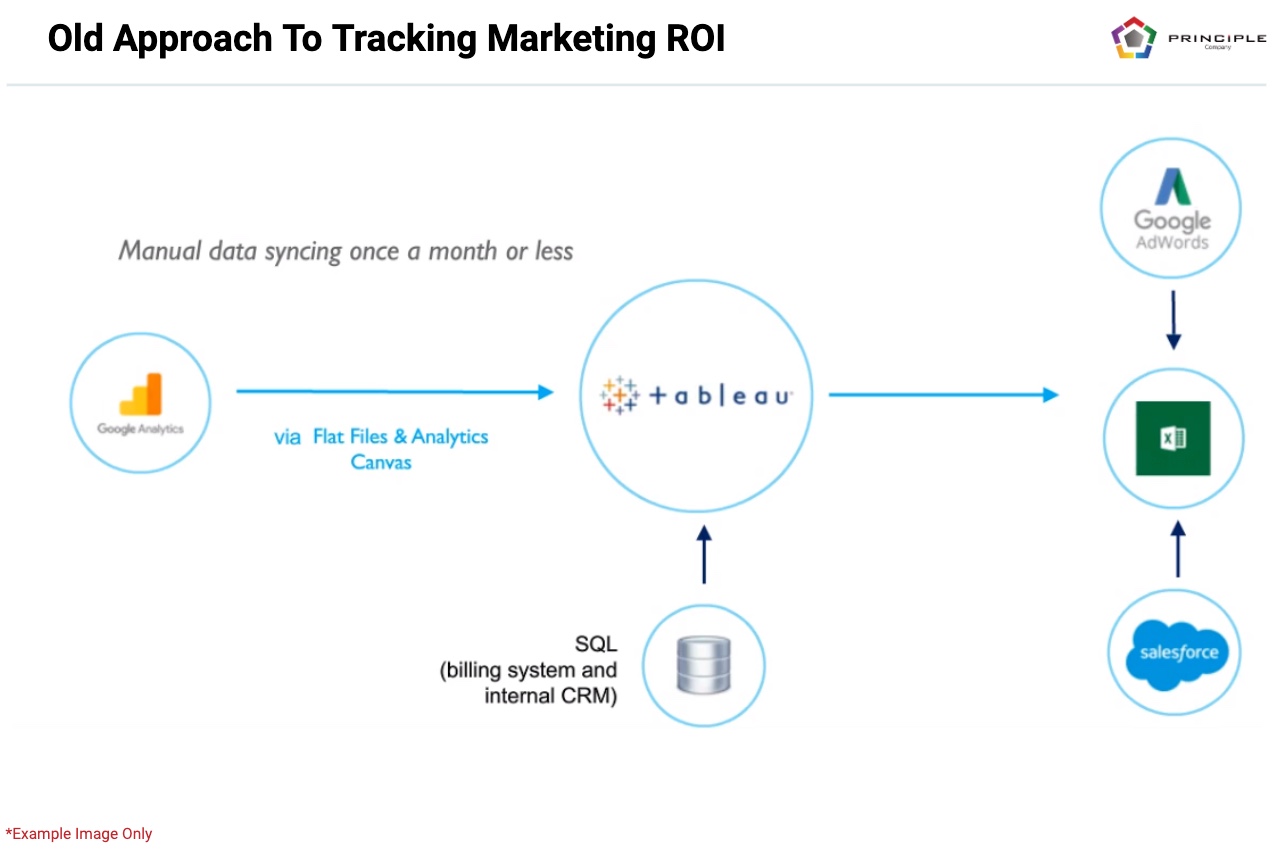
A typical approach we see marketers use for tracking marketing ROI is illustrated in the following diagram (below). We find it especially common for fast-growing companies who have not yet invested in enterprise-grade solutions or worked with consultancy/services.
Idea is, marketers would extract data from various marketing technology tools, and the static data would be compiled in Excel, Tableau, or some equivalent data tool.
Data could be transformed and processed in various tools in different steps, but it usually ends up being something homegrown and proprietary.
It usually doesn’t end up nicely, especially when that knowledge and process sit with an individual, and the company finds itself in a problem when that individual leaves the company.
Data siloes are never good, especially if you consider marketing data is the company’s asset and a very important asset that holds customer information that helps your business scale.
Building a data warehouse like a DMP or CDP
A “Customer Data Platform” is a marketer-controlled integrated customer database that can support coordinated programs across multiple channels. — Gartner
A data management platform (DMP) is a unifying platform to collect anonymous data and organize data from multiple data sources including offline and online. It is usually the backbone and data foundation that supports data-driven marketing.
A common distinction to note the difference between DMP and CDP is that DMP is all about collecting anonymous data, while CDPs are focused on 1st party data (or individual user-level data).
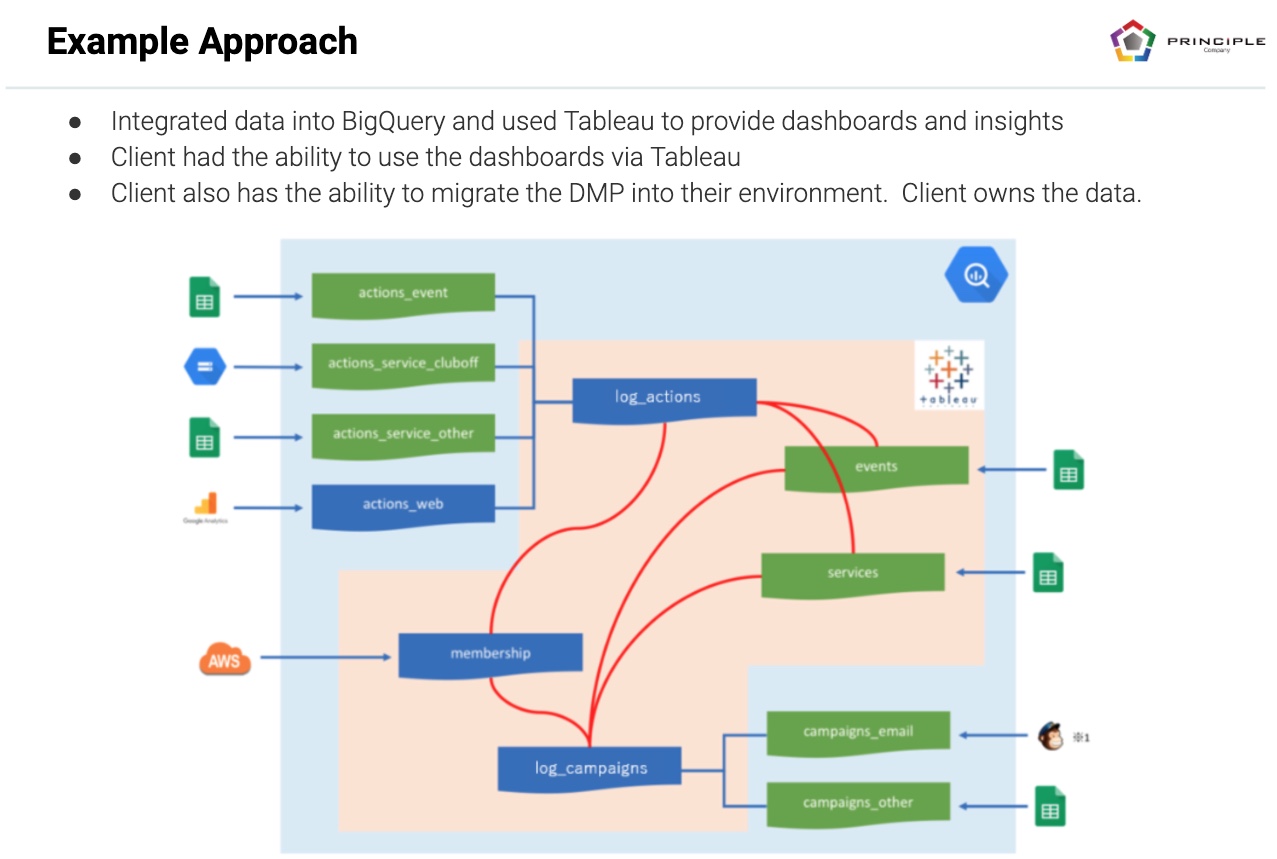
In most cases, businesses that invest in digital marketing would have data from various tools, Google Analytics being the most common one. Here is an example diagram from one of our work building out a DMP.
Long story short, we’ve ingested data from various sources into Google BigQuery and used Tableau to build custom reports. This approach allows us to help our clients get the insights they need fast, and retain the agility to act on it (e.g. send segmented data to Ad Tech platforms).
Google Analytics acted as a tool that manages the session tracking for various campaigns and retains user behavior data. Not only it helps us build a clean schema that is easy to analyze and work with, but it also enables advanced reporting capabilities once the data is used with tools like Tableau.
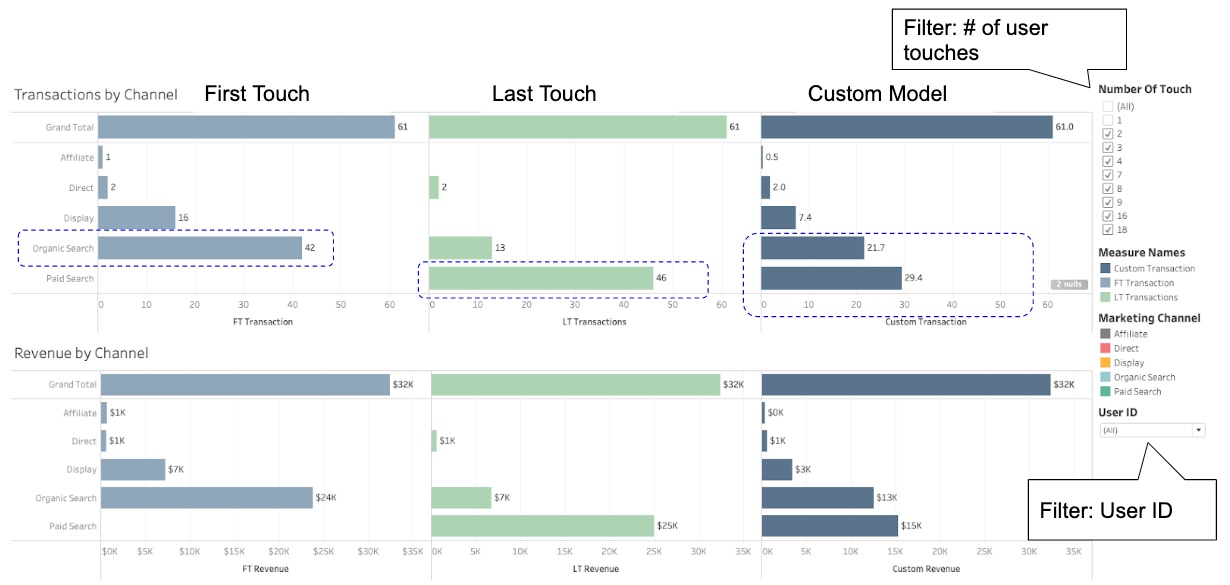
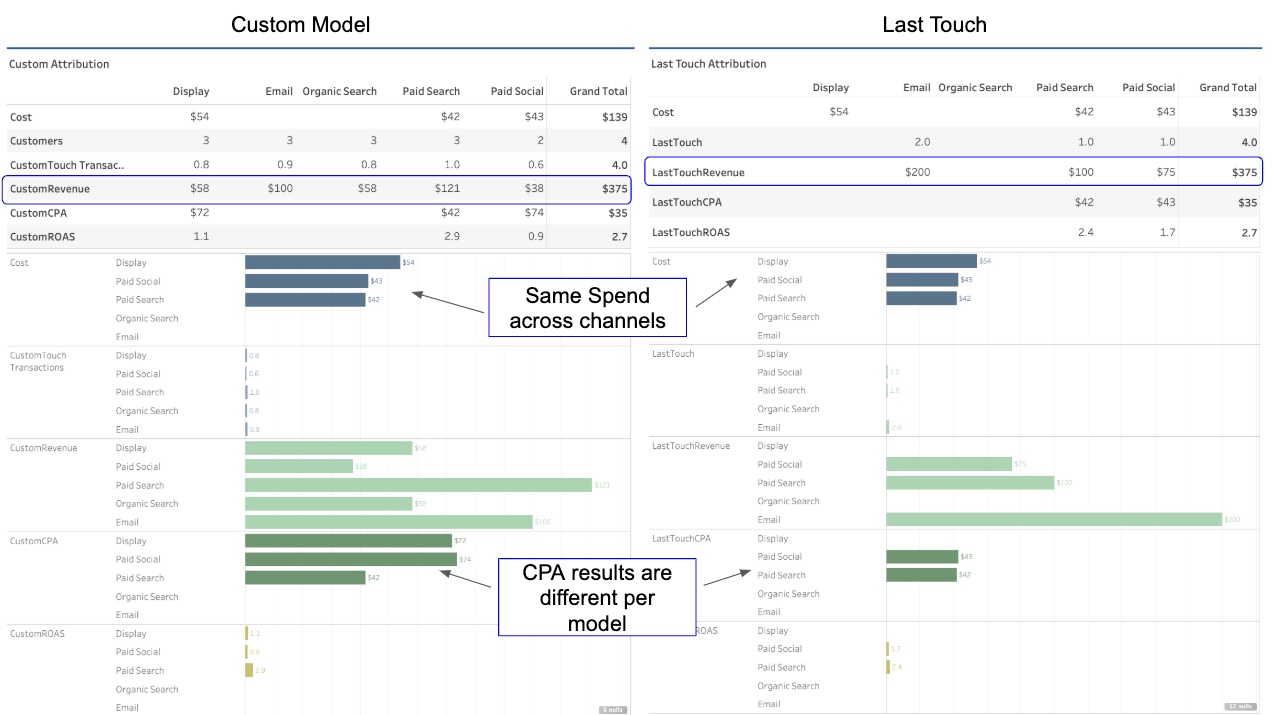
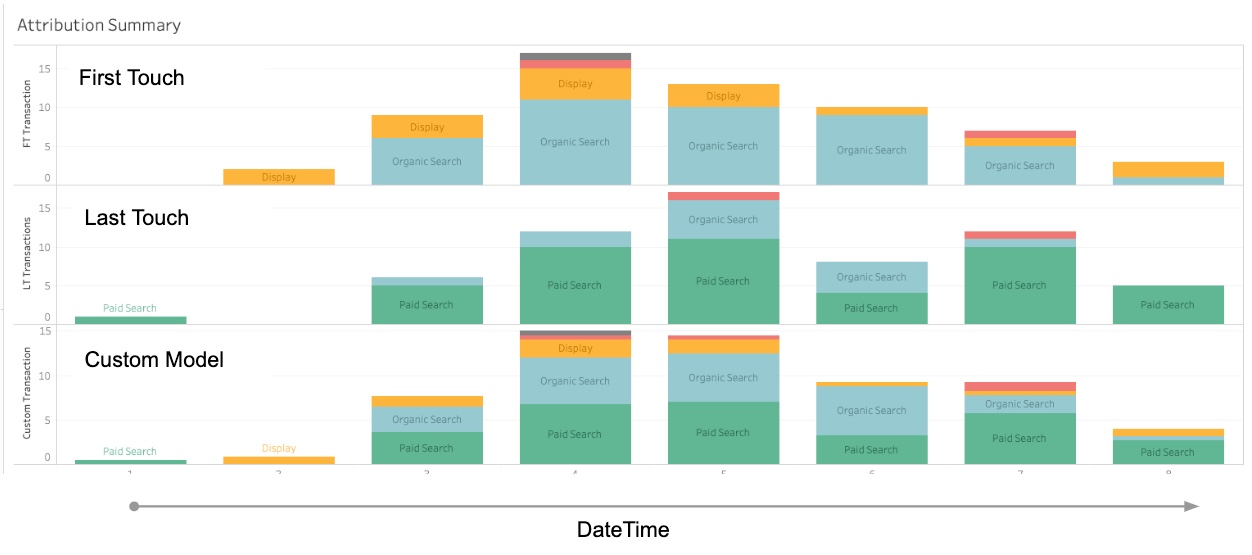
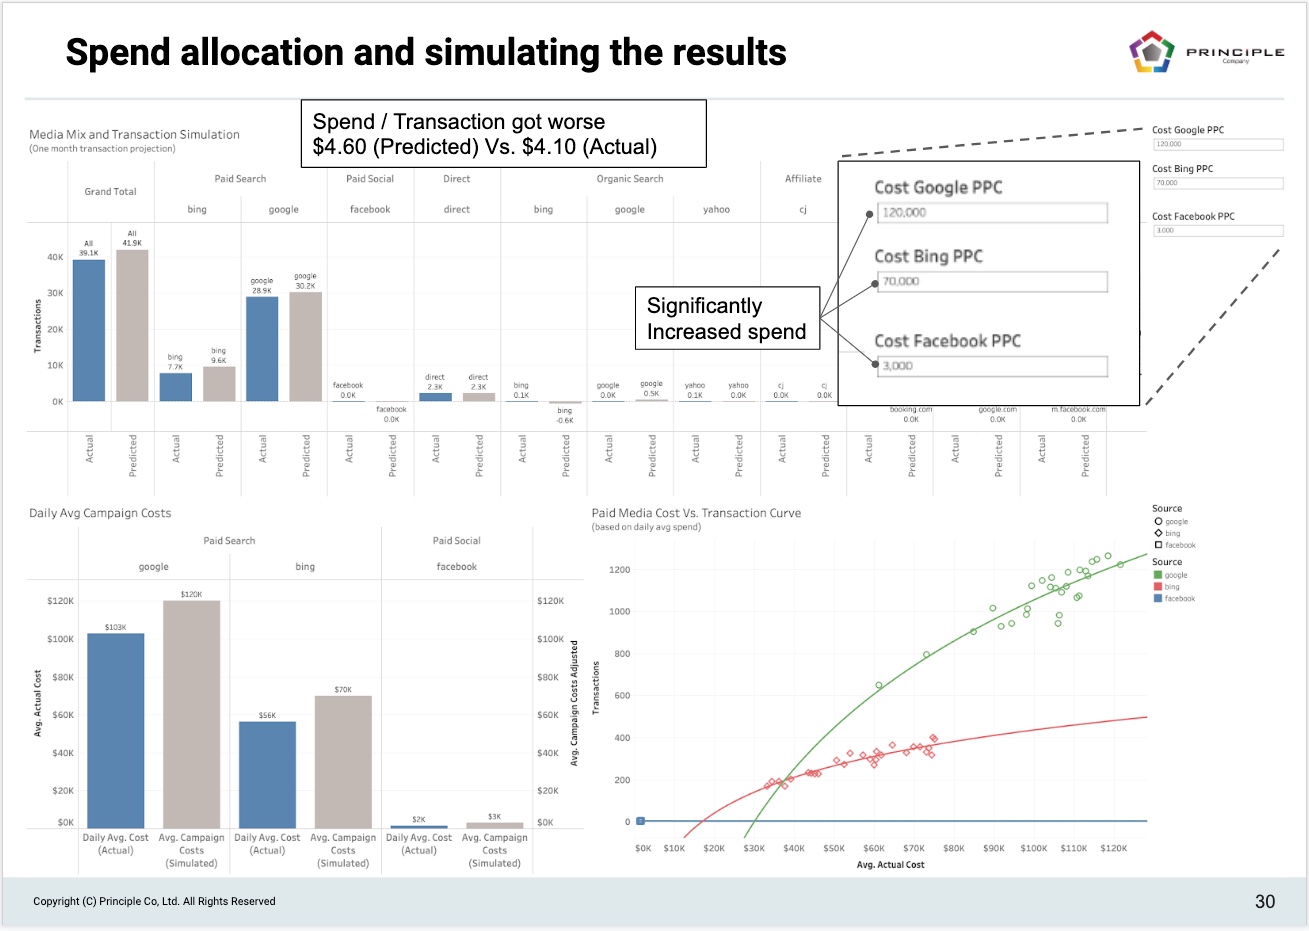
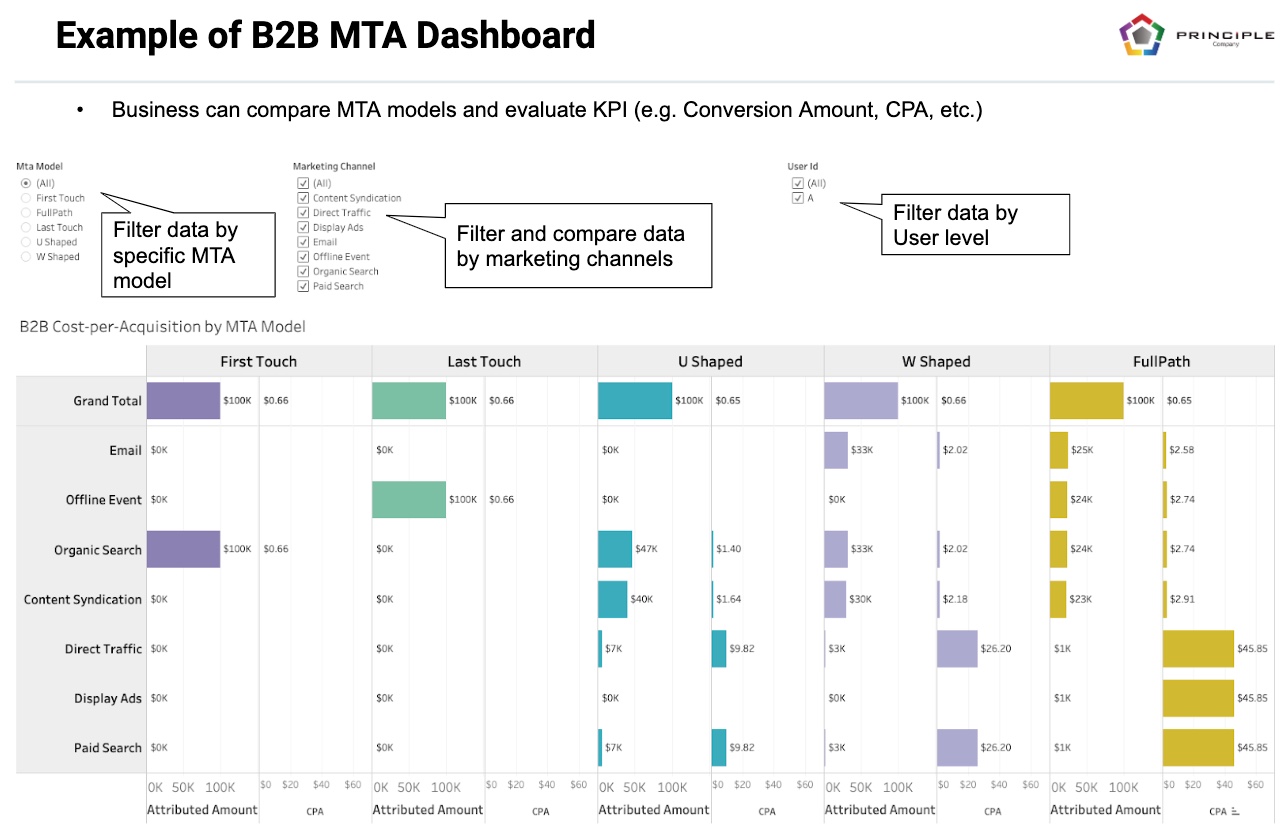
Example dashboards built on database and tables for MTA
Here are some example dashboards we built out of Google Analytics and other integrated data that are dumped into Google BigQuery. Visualization is powered by Tableau.
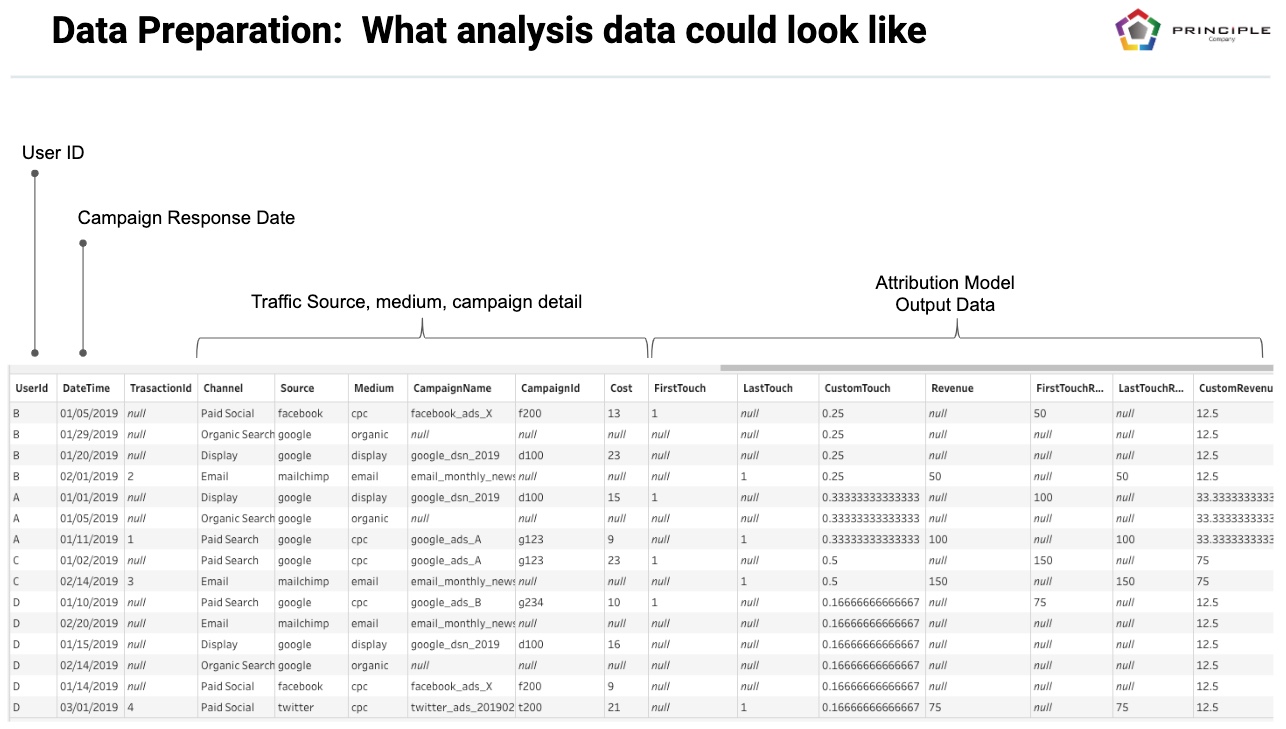
Data Preparation
In these example dashboards, the data is queried from Google BigQuery. However, the attribution models had been built from various tables that were generated from Google Analytics.
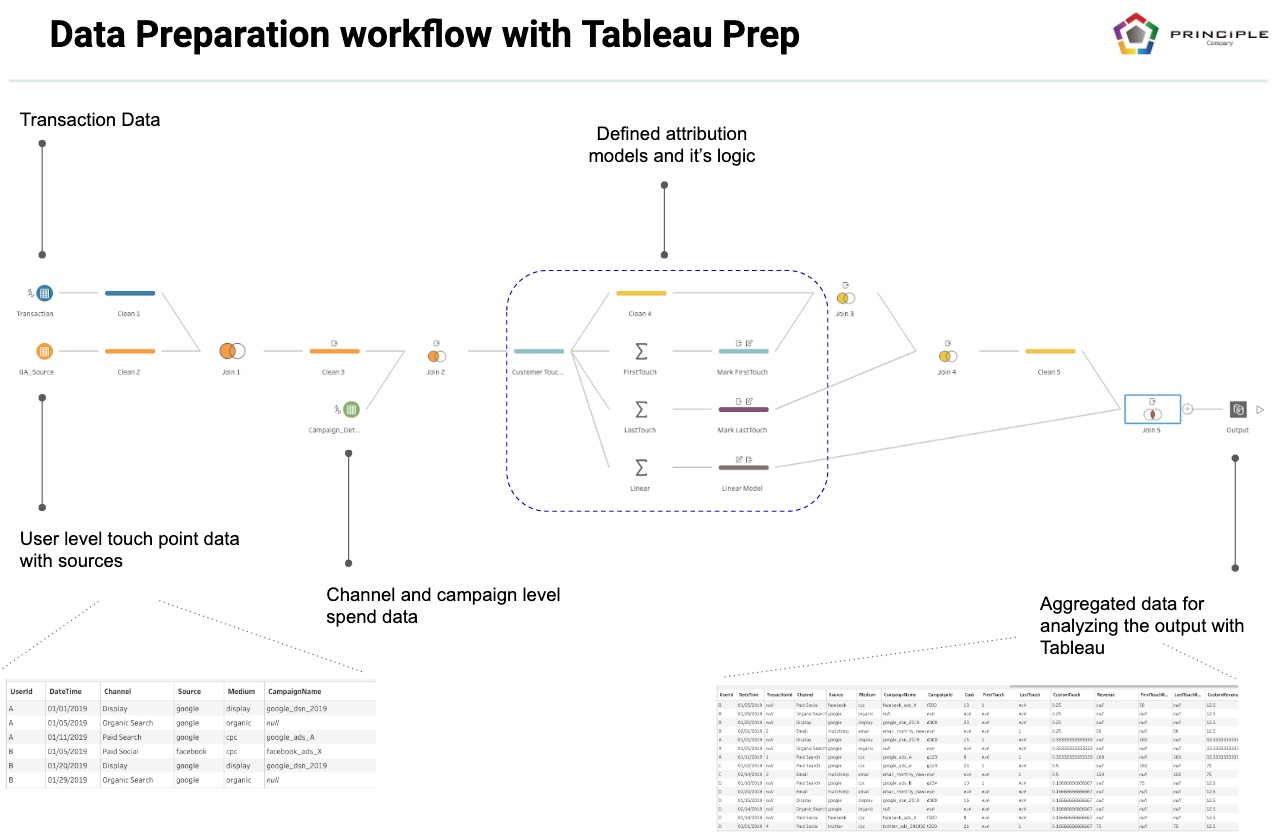
There are a few ways you can do this. One approach is to build it using BI tools like Tableau Prep to transform the data final data table with various attribution outcome. Another approach is to simply build view tables within Google BigQuery that generates the final table containing different attribution model outcomes.
Application of User-Level data for MTA Analytics
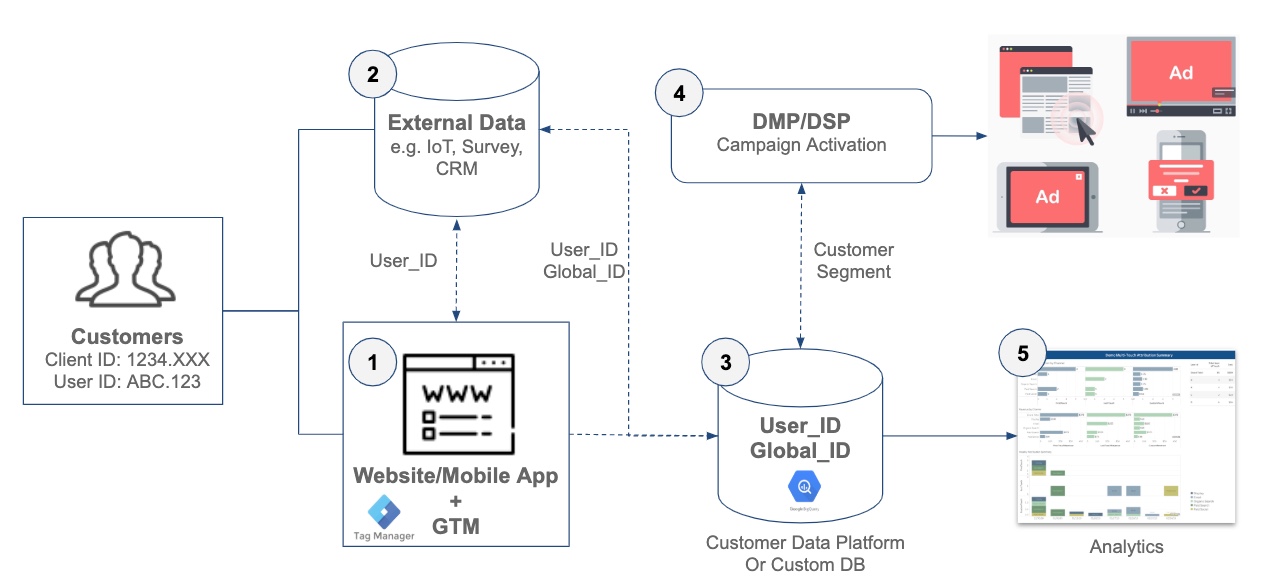
When we help clients implement user-level tracking in Google Analytics and integrate with Google BigQuery, it helps new data and marketing capabilities as highlighted in the following diagram. These areas of deployment are essential for user-level MTA analytics.
- Data management for Web and Mobile App: Google Tag Manager (GTM) manages to track on website (SDK for a mobile app) Conversion event generates User_ID
- Integration with external data: External data captured thru another tech stack w/ data points like User_ID
- Marketing data platform: Data platform generates and manages Global_ID, a universal ID tag can identify a user in the database. Principle helps clients create such a data platform to support marketing before they invest a lot of money in CDP.
- Campaign activation: CDP integrates with the DMP/DSP where Ad activations take place, targeting prospects and existing customers with optimized Ads
- Analytics capabilities: The data will support analysts to dive into user-level data and obtain insights using BI tools like Tableau.
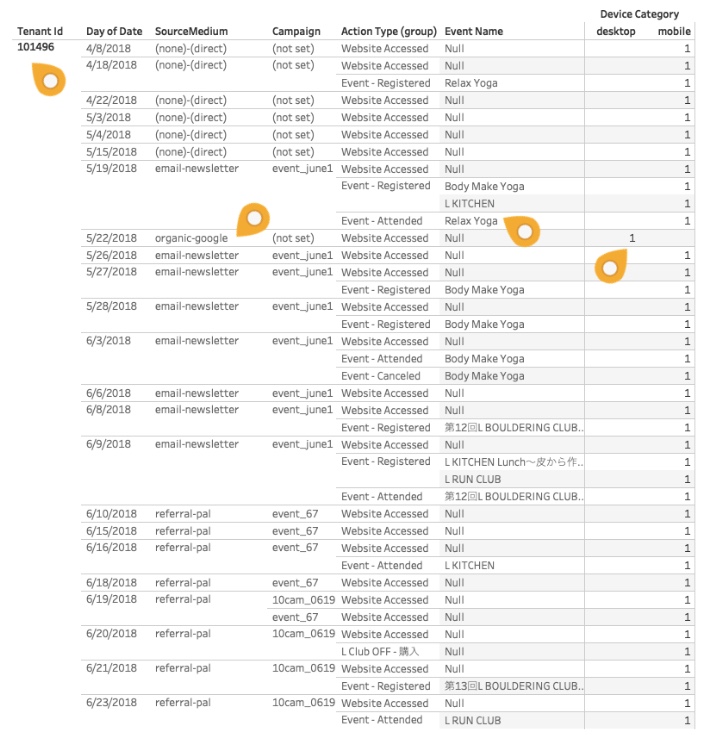
When you get the user-level data with ID in your data schema, we’re able to provide the touchpoint reporting along with filters and dimensions that allows a marketer to drill down to specific users. Or even a group of users that are a meaningful segment to the business.
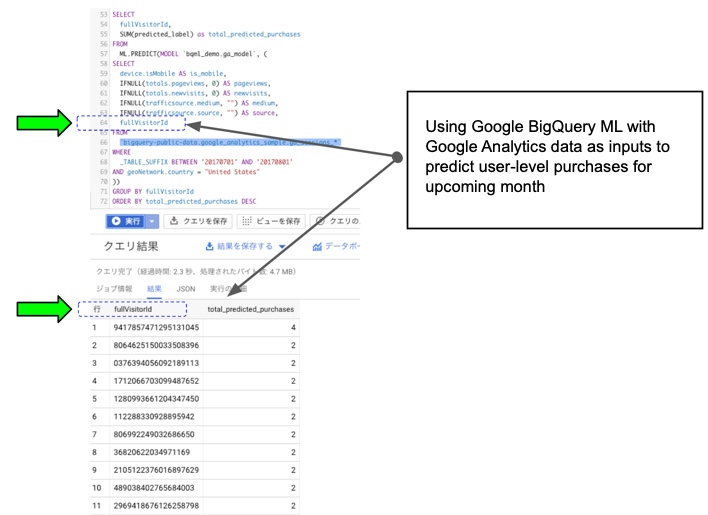
For a case where our clients store the Google Analytics data in Google BigQuery, we can use BigQuery ML to perform predictive analysis on user-level data to see how much they’ll purchase in the upcoming month.
The data inputs could vary by business, but some of the ideas are; campaign detail (cost, impression, medium, visits), traffic sources, product purchased, timestamp of the visits, number of page views within a session, new or returning visitors flag, first time or repeat customer, etc. The majority of these data could come from Google Analytics.
BigQuery allows us to run standard SQL against the dataset and build a machine learning model. Because we don’t have to move data across different environments, speed to building model is fast.
In Summary
If you’re interested in multi-touch attribution and would like to see how you can best leverage existing tools like Google Analytics before investing in a very expensive solution, we’re here to help. Feel free to reach out here.
The majority of our clients start working Principle from reviewing their Google Tag Manager and Analytics deployment to make sure they have the right data and tracking in place. Simple as the free Google Analytics tool could be very powerful if you implement and adopt it right.
This data foundation helps Principle optimize client’s paid media budget and improve their campaign performance.
The 3 key things we hope you got from this article are the following.
- Don’t underestimate the free Google Analytics. Make sure you get the implementation and manage your data right. Good data for your downstream system and reporting is a start for great digital marketing practice.
- Make sure to take advantage of data integrations, and apply user-level data enablement. Your 1st party customer data that are very important for your marketer to have under management. Not only it enables new capabilities to better execute campaigns, but it also helps great analytics practice.
- Lastly, if you’re able to obtain great MTA data and adoption of the data for your marketing practice, it will support you as a solid foundation for advance marketing like predicting buyer behavior, marketing budget allocation, etc.
Links and References:
Unifying multitouch attribution and marketing mix modeling
Nielsen – Real Returns: What matters most in digital advertising
What is Multi-Touch Attribution?
Do you need to enable the right marketing data to grow your business?
Good data practice starts with good data collection. At Principle, we enable, integrate, and manage your marketing data. Click here to learn more about our agency services for:
- Data Management Consulting Service
- Data Visualization Services with Tableau and Data Studio
- Google Tag Management Service
- Marketing and Google Analytics Services

Director Analytics
Over 16 years of experience working with data and marketing. As a data expert in marketing, Kris enjoys analyzing data to bring actionable insights and help businesses move forward. Kris has experience working in industries ranging from Tech, SaaS, FinTech, B2B, Mortgage/Banks.