Common Problems when Connecting Google Analytics to Tableau
We all know that Tableau is user-friendly. You do not have to be a Tableau pundit to create a simple bar chart in Tableau. A few clicks of drag-and-drop and you will be good to go. But when it comes to connecting data to Tableau, it might require you to do a little bit more thinking.
As a Tableau consulting company, we deal with data every single day. Different clients have data stored in different places. One of the most popular data sources is Google Analytics (‘GA’). GA helps you keep track of site traffic and many more. In this topic, we are going to introduce common problems people encounter when connecting GA to Tableau.
The first problem is the granularity of data. Each data table has a level of granularity. For example, a data table with a Date has a column that has a month-day-year value. Not being aware of the table structure and granularity might result in misleading numbers. In this article, we will show you how the granularity of the Date dimension affects how GA counts the number of users, and how custom dimensions affect the number of sessions and pageviews.
The second problem is when you have more than one data source. The granularity still matters if you want to connect to two or more different data sources. If the tables have a one-to-one relationship, there should be no problem connecting the data sources., But, if the relationship between tables is one-to-many, you might need to consider which one to use as a primary data source.
These two problems are worthwhile to be aware of. Now let’s see each in detail.
1. Dimension granularity
1.1 Date dimension with multiple users
Let’s start by connecting GA to Tableau. Note that you can connect GA up to 7 dimensions and 10 measures in Tableau.
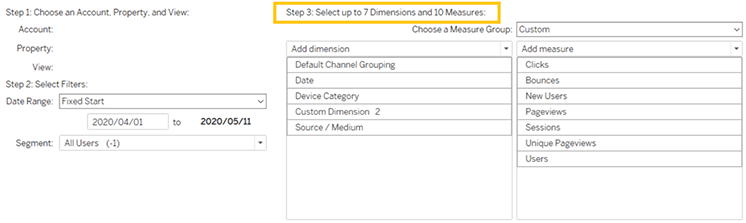
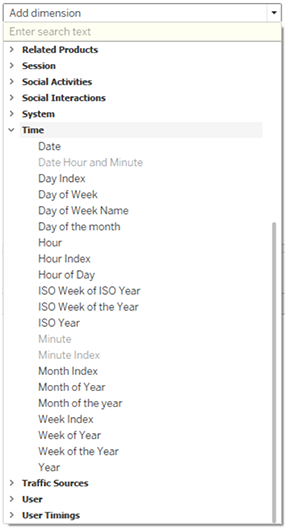
On most occasions, the dimension that you usually need when connecting to GA is Date. The options are listed under Time in GA. You might notice, there are many options available such as Date, Month of Year, Year, etc. Depending on the granularity of data you choose, GA might present a different number for the same metric.
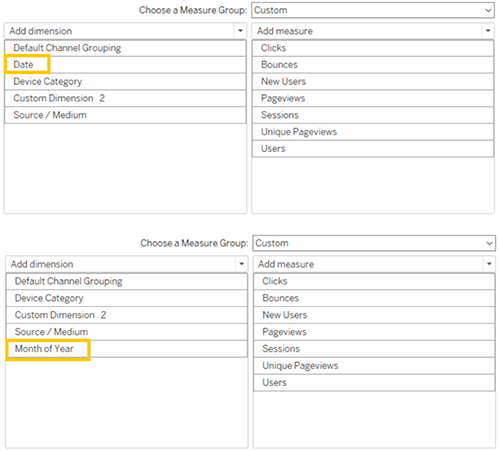
We set up two GA data sources in Tableau. One with Date dimension, it shows yyyymmdd (Scenario 1). The other is Month of Year, i.e. yyyymm (Scenario 2). Other dimensions and measures are held the same. We can say that these two data sources differ in granularity, one is at a day level, the other is at a month level.
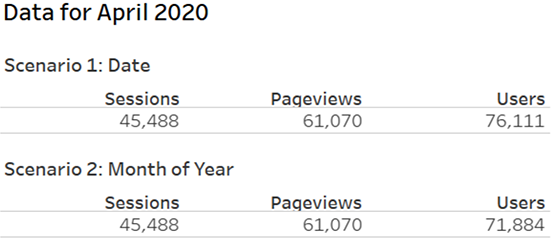
It is normal to assume that whatever measures we take from GA would have the same numbers in both day level and month level scenarios, given the same period of time.
Now let’s look at the result in Tableau, the number of Sessions and Pageviews are the same for both Scenarios, but not Users. Why?
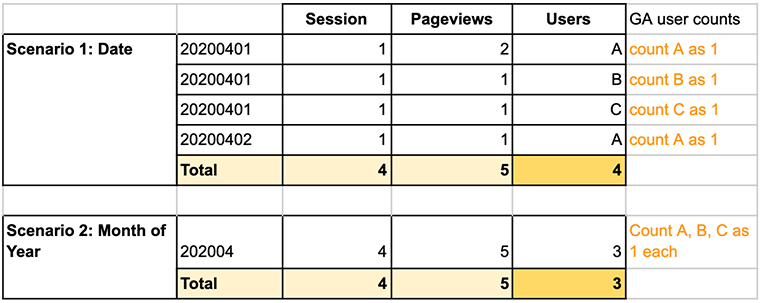
The reason relates to what table structure Tableau can extract from GA API, according to data granularity we choose. See the table below for an easy explanation. The data structure itself for Scenario 1, User A visited the website on 1 April 2020 and also 2 April 2020, once a day. Because we set the dimension as Date, GA summarizes data on a daily basis and then recognizes User A as different users on each day and counts each as 1, so the total Users number is 4 (A,B,C,A).
On the other hand, in Scenario 2, where there is only a year and month, GA summarizes data on a monthly basis and then does a unique count of users. So the total number of users is 3 (A, B, C). GA does not care whether User A visited 2 times in that period. It only cares that one unique user A visited the website during that month. However, GA still counts Pageviews and Sessions based on numbers of visits.
So, now we know that GA will aggregate data based on the granularity of dimension. Therefore, the level of Date matters.
When you want to create a report, perhaps on a daily, weekly, or monthly basis, you want to make sure that you are using Date dimension for a daily report, and Month of Year dimension for a monthly report. If you are using the Date dimension for a monthly report, you should make sure others, who look at the report, have the understanding that the number of users is unique users. Otherwise, it might lead to misinterpretation.
1.2 Custom dimension granularity
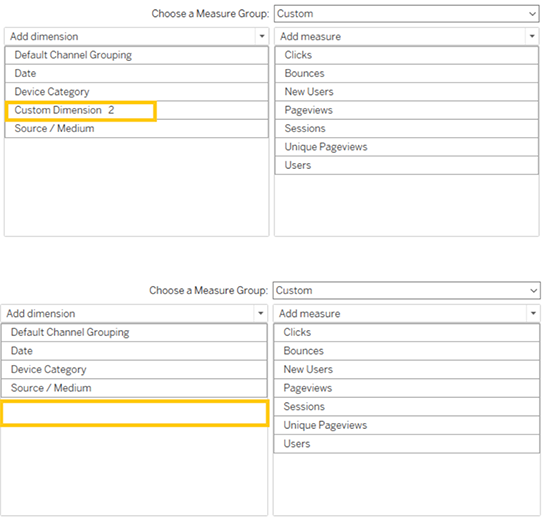
We are going to show you another example of dimension granularity. GA allows you to set a custom dimension. In this case, our custom dimension is Client ID which is an ID assigned randomly by GA to every user. Again, we will use two different data sources to compare the numbers. We will borrow Scenario 1 because we already added a custom dimension there. We created Scenario 3 using the same setting but without a custom dimension.
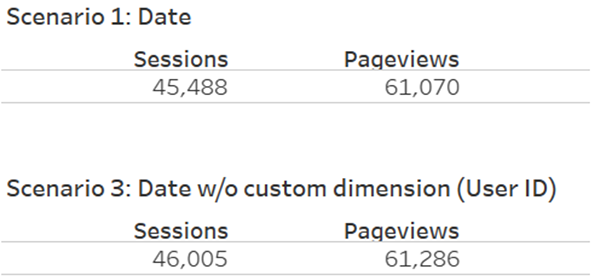
Now, we connected to Tableau and noticed all of the Sessions and Pageviews are different in both Scenarios, where Scenario 1 is showing lower numbers.
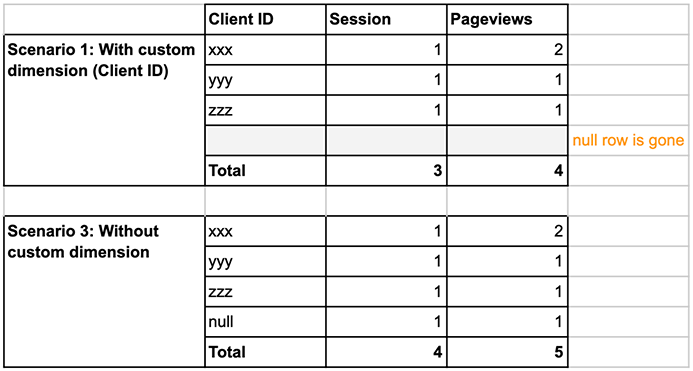
A custom dimension is an extra dimension that requires additional settings so GA knows how to track that data. Take a look at the example in Scenario 3. The custom dimension is Client ID. GA is able to recognize the dimension, it knows that xxx, yyy, zzz are Client ID. However, not every datum is tracked properly. So in GA there are also rows of Client ID with a null value as well.
When we tell GA to pull data without a custom dimension, GA collects every row regardless of the completeness of the custom dimension setting. Contrastly, in Scenario 1, when we set a data source with a custom dimension, GA will only collect those rows with a completed custom dimension setting. In this case, the rows GA collects are only for Client ID xxx, yyy, zzz. GA will omit the rows with a null value. Therefore, the Session and Pageviews for Scenario 1 will always be less than in Scenario 3.
2. More than one data source
GA is handy because there are many dimensions available to select. But sometimes, we need additional data sources for dimensions or measures that are not available in GA or cannot be tracked. If the new data source has the same granularity with GA, there should be no problems to Blend the data sources.
In this example, we have a CSV file that has industry details of our clients who visited our website (Client ID).
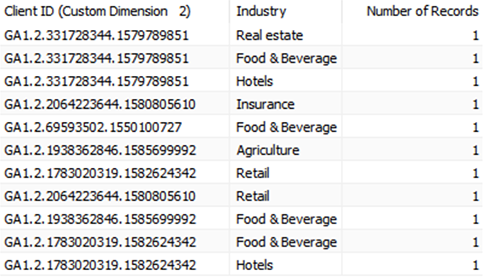
We want to know which industry visits our homepage the most. This could help our sales teams to answer which industries to focus on when doing sales and marketing activities.
We limit our data to only 5 Client IDs for an easy example. Some companies are conglomerates so they operate in more than one industry. For example, Client ID 331728344.1579789851 operates in 3 industries i.e. Food & Beverage, Hotels, and Real estate.
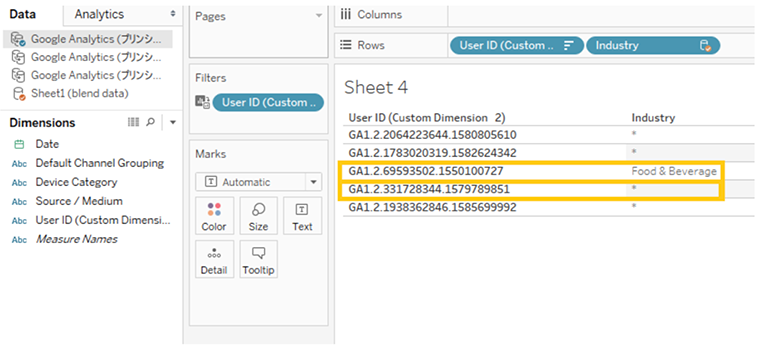
Now we want to Blend this to our GA data source. Again, we use Scenario 1 as the primary data source. The client industry detail is a secondary data source. The relationship between these two data sources are connected by Client ID. So we Blend on Client ID. We see that there is * in Tableau for Client ID GA1.2.331728344.1579789851. This is because this Client ID is in 3 industries and Tableau does not know which industry it should fill with.
While for Client ID GA1.2.69593502.1550100727, the company is in the Food & Beverage industry. There is only one industry so Tableau knows what to fill in.
If we have to illustrate the table, it will look like this.
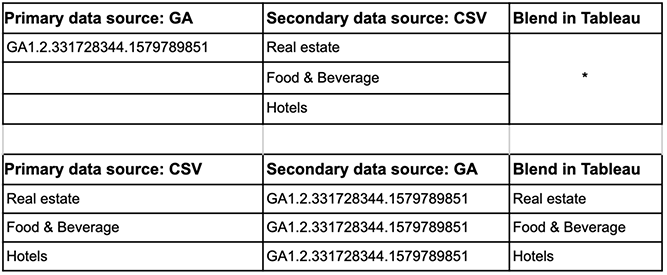
In order to solve this, we know that the CSV data source has higher granularity, we can switch and use it as a primary data source. Our table in Tableau will look like this.
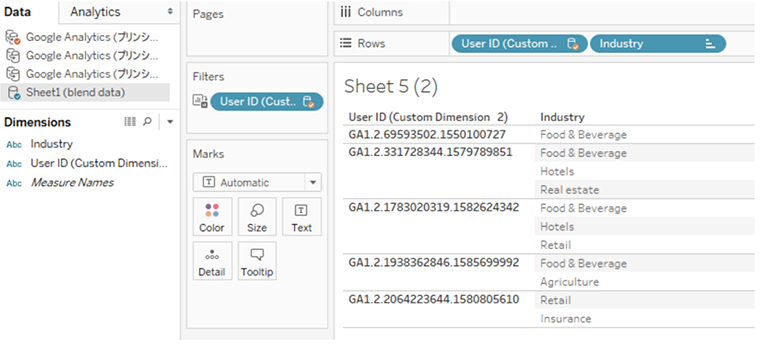
Now getting back to our question, the industry with the most pageviews. A simple bar chart can answer this question.
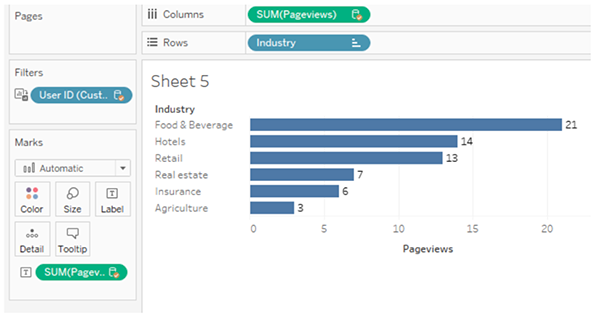
Users in the Food & Beverage industry have the most pageviews on our website. So, this could be a preliminary analysis for our sales team to focus on by following up on F&B sales leads.
Final words
Being able to connect GA to Tableau directly is convenient enough. But without an understanding of how GA and Tableau work together, the numbers retrieved can be inaccurate and misleading. We hope this reading was helpful for you in obtaining accurate data and conducting a valuable analysis.
Do you need to enable the right marketing data to grow your business?
Good data practice starts with good data collection. At Principle, we enable, integrate, and manage your marketing data. Click here to learn more about our agency services for:
- Data Management Consulting Service
- Data Visualization Services with Tableau and Data Studio
- Google Tag Management Service
- Marketing and Google Analytics Services