Building Paths Checker with Tableau Using Google Analytics Data
Google Analytics contains a “Users Flow” report which represents the page paths users has taken on the given website. Regarding this report, there is one issue that it is not so user-friendly, so I made a brief site path checker with Tableau.
This method uses the following three elements that are preset dimensions in Google Analytics (and do not require custom dimensions for acquisition):
- Landing Page
- Second Page
- Exit Page
The report uses data of (A) the first pages where users started their sessions, (B) the next pages users went to, and (C) the last pages where users ended their sessions.
(A) and (B) are hits associated sequentially, but (B) and (C) are not. We cannot tell how many hits there were between (B) and (C).
For these metrics, sessions are essential. Additionally, in terms of metrics on session scope, “page/session” and “average session duration” will be valuable measures. Pageviews, session duration, and the likes should not be averaged when they are fetched for Tableau.
Finalized Visualization

The small circles placed on the big circumference stand for pages. One circle placed in the center of the circumference stands for “(not set)”. “(not set)” in Google Analytics means, the second page is not set, which means that the users simply bounced.
The thick line drawn from the three o’clock position to the center stands for the sessions where users landed on blog article pages and bounced. I made the thickness of each line corresponding to the number of sessions, so you can see this thick line is the largest of all the individual paths.
At this point, the visualization cannot tell us more than the fact that “dozens of pages were viewed in dozens of ways”.
So the filters come in handy to make this more meaningful.
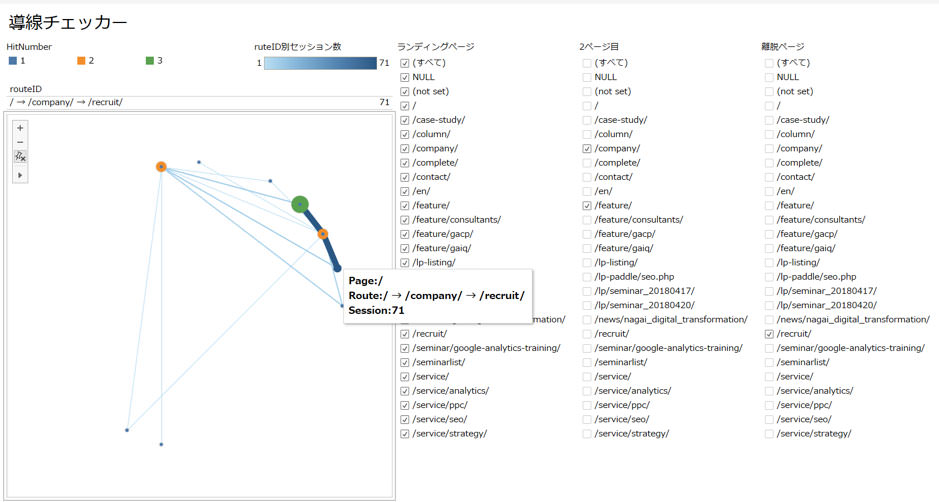
The visualization I showed above is filtered with the following conditions:
- Ignore the landing pages
- Lookup for those who passed /company/ or /feature/ as the second page
- Lookup for those who exited at /recruit/
With these conditions, I figured out that the most frequent brief path was “/” → “/company/” → “/recruit/” which stands for Top Page → any page under Company Introduction → Hiring Page.
We can assume that users who reached Hiring Page viewed “/company/” (Principle’s basic company information) more often than “/feature/” that contains details about Principle’s services, qualifications, partners, clients, etc.
How I Created the Visualization
I referred to “Metro station traffic in Paris, France” on the Tableau Help contents.
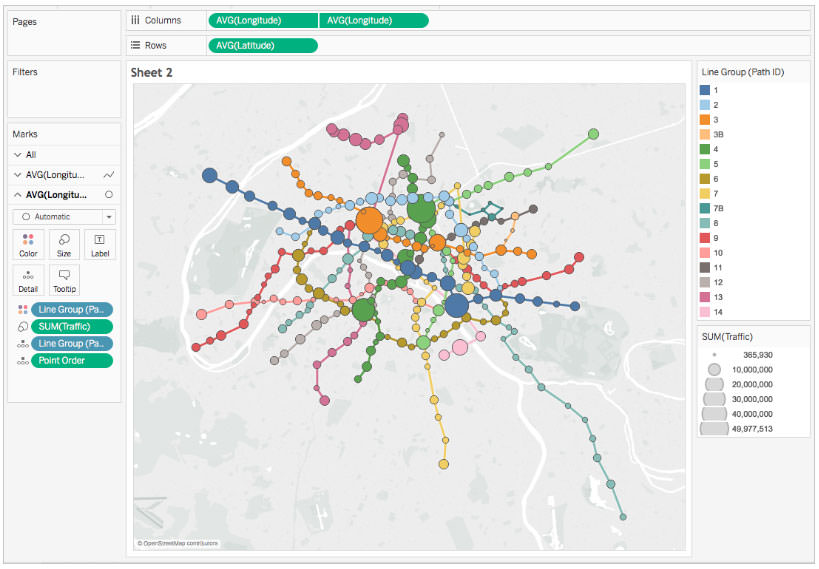
However, in this example, pages do not have geographic attributes such as latitude and longitude, so the X-axis and Y-axis are instead applied.
The axes is divided into 24 lines resulting from dividing 360 degrees by 15 degrees and are placed on the circumference by using Excel. In the center of the axes is placed the value “(not set)”.
As for the raw data on the number of sessions for each route etc., a direct API connection from Tableau Desktop to Google Analytics will not bring the desirable data. I, therefore, created a custom report on Google Analytics, exported into the Excel format, and made it JOIN in the Excel file of the axis tables by utilizing Tableau Prep.
The whole process reminded me again of the powerful data preparation functionality of Tableau Prep.

Why are the Pages Placed on the Circumference?
While designing the visualization, I also had in my mind to implement a design that depicts the user paths going from left to right. I planned to align 24 columns of landing pages on the left side, 24 columns of “second pages” in the middle, and 24 columns of “exit pages” on the right side.
For this design plan, I was worried about worsening space efficiency.
That is, within the 24 landing pages listed vertically, it would be quite possible that the topmost page appears as the “second page” to the bottommost page.
Taking this point into consideration, I thought that the best way for space efficiency was to organize the data in a circumference. However, in this case, it is not easy to view paths between two pages that are located adjacent to each other. A solution for this issue would be to reduce the pages that are defined as the targets for capturing the paths.
Summary
I do admit it is not highly practical, though we were able to briefly confirm what paths users were taking on the website by utilizing the filter.
Additionally, I hope that this example visualization would inspire to adopt path analysis using page path data along the circumference.
We Principle provide customers with data visualization as one of our services through Tableau. You will get dedicated support from our consultants who really love Tableau and data. If you get interested, please feel free to reach out to us.
In addition, we provide customers with data visualization service by using Tableau and help businesses improve their marketing performance by using Google Analytics data through Tableau.
Do you need to enable the right marketing data to grow your business?
Good data practice starts with good data collection. At Principle, we enable, integrate, and manage your marketing data. Click here to learn more about our agency services for:
- Data Management Consulting Service
- Data Visualization Services with Tableau and Data Studio
- Google Tag Management Service
- Marketing and Google Analytics Services

Co-Founder / Analytics Evangelist
Kaz is a Co-Founder of Principle and leads Principle’s search and analytics solution teams. Kaz has published books on Google Analytics and Tableau Data Visualization. He is an industry-recognized leader. Kaz retains certifications: Google Analytics Partner, Tableau Certified Professional.